Making Our APIs Solid, By Breaking Them In Production
Collecting a data-set that our customers can trust is a precondition for our product to be useful. The difference between data collection working most of the time and all of the time is the difference between our product being flaky or stable.
You can only get so far by whiteboarding your stack and trying to handle foreseeable failure modes. At some point, you need to see failures happen under production load to know what will happen. Taking inspiration from Jepsen and Chaos Monkey, we intentionally and repeatedly broke our system in production to learn what needed fixing.
Interested in learning more about Heap Engineering? Meet our team to get a feel for what it’s like to work at Heap!
Starting Simple
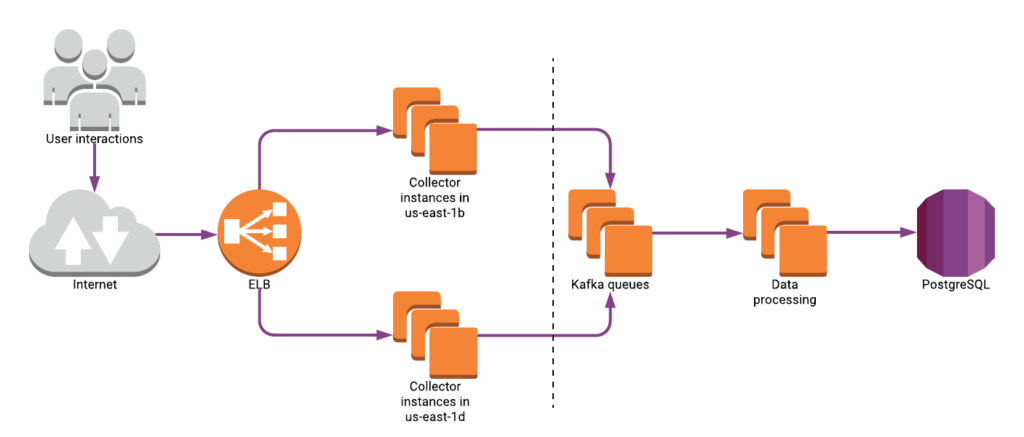
In the diagram below, our “Collectors” are responsible for catching every incoming event we track for our customers and persisting them to Kafka. Once there, our system has redundancies to protect us from data loss. Events we do not catch successfully, we lose forever.
When a Collector cannot connect to Kafka, it spools messages first in-memory and then to disk until Kafka becomes available again.
Our API is designed to be load-balanced between two Availability Zones so that a single outage cannot cause us to drop incoming events. Even if Kafka is completely unavailable, as long as one Availability Zone of Collector instances remains available, we shouldn’t lose any data.

But this is just a story. Proving this to be true is where this engineering adventure starts. We knew from the start there was at least one failure mode involving a dependency on Redis availability.
To discover this, and any other failure modes, we simulated AZ outages by separating our Collectors in us-east-1d from all other servers and monitored their ability to keep processing API traffic.
Testing with Simulated Traffic
Because we expected our first tests to fail, we did not want to start with production traffic. Instead, our tests would remove the Collectors in us-east-1d from the ELB, then simulate an AZ outage and generate some artificial traffic to the separated Collectors… and see. We would only add the Collectors back to the ELB after the tests were over.
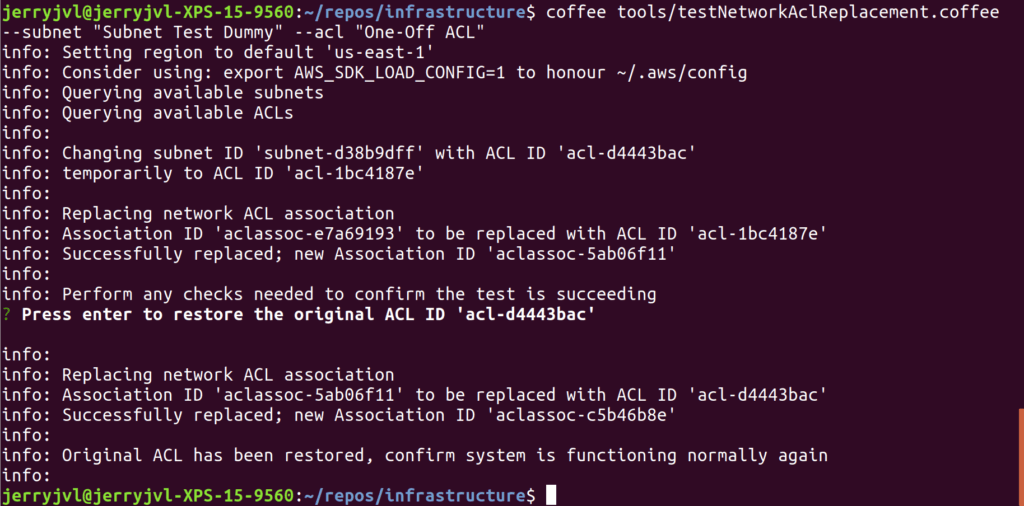
Removing the Collectors in one AZ from the ELB is a simple single click in AWS, but simulating the AZ separation meant replacing the network ACL for the subnet of these Collectors. Twice. Being a little nervous about fat-fingering I first developed a small script to apply both changes with a manual confirmation in between.

Our expectation for the first iteration was that traffic under separation would result in 5xx responses for all API calls, caused by NGINX timing out slow responses from Collectors.
It took a couple of attempts to get the system to “correctly fail.” First, the network ACL used to simulate the outage did not include rules to cut off traffic to Redis or Kafka hosts, so it only simulated a partial availability zone outage. Second, the dummy API requests did not contain the right metadata to trigger a particular codepath that makes use of a centralized Redis instance.
After iterating on our test rig, we were able to produce 5xx responses in production. We determined that APIs that used Redis were waiting much too generously for requests to complete before failing them. I.e., our timeouts were too high, and requests queued in the Collectors for too long when Redis was unavailable.
Debugging these failures via our metrics proved difficult, since our code happened to mix together different kinds of failures into the same metric. To get more insight, we attached a debugger to an isolated Collector under artificial traffic to step through an entire API call. In the process, we uncovered a deficiency in the version of async we were using which was the root-cause of a severe outage at the time. Internally async.retry constructs a large array of execution attempts, which leads to GC pressure with our default number of retries.
We had found two failure modes on this API endpoint: geo-coding, in which we map IPs to approximate geographic locations, and rate-limiting. This inspired a half day of manual code inspection across all other end-points. The only other apparent problem was a PostgreSQL lookup used in a deprecated API. It already had adequate error handling for the low amount of traffic it might continue to receive under AZ failure, so we decided to take no further action on it.
Fixing the Redis Calls
For our two Redis calls, we settled on skipping geo-coding and rate-limiting as acceptable default behavior under stress. And we implemented a sub-second timeout for these calls.
Re-running the outage scenario with simulated traffic showed 5xx responses were no longer happening, and almost all events eventually reached the system. Almost all.
Partway through the outage scenario, we restarted the Collector we were testing on, and we lost all events received before the restart. We routinely restart the Collectors as part of normal operations. Losing events when this happens is a worrying prospect.
Another deep-dive into the code, looking through the Kafka spooling code under restart conditions didn’t reveal anything obvious. At the same time logging triggered by shutdowns didn’t appear to flush on a restart either, which left no hard data to build an analysis on. Assuming something in our code was to blame, we made several iterative improvements to the shut-down process and logging. Although the code became higher quality in the process, there was no observable difference to successful logging through the restart.
It was time to take a step back and look at the bigger picture — if both the log flushing code and the Kafka spill-to-disk look correct, but neither of them happens, maybe the process dies before it gets that far.
We use the pm2 Node process manager for our Collector processes. We restart Collectors using pm2 gracefulReload, which issues a SIGINT to the managed process and waits for termination before restarting it. Unfortunately as per the small print, if the process is still running after a timeout, it gets terminated regardless. The default timeout is 3 seconds. Our SIGINT handler allowed 4 seconds, and our Kafka spooler was taking every last one of those seconds to try and get messages out before terminating.
We re-configured pm2 to allow 6 seconds rather than risking side-effects from reducing our SIGINT handler timeout. The outage scenario was extended to include a restart during separation to make sure this got tested as well going forward. And on the next run of the scenario, everything was looking rosy.
Graduate to Breaking Production
Exposing customer traffic to an intentional breakage is intimidating. We decided to try separating a single server only first; unfortunately, the network ACL we had been using so far could only be applied to all Collectors in a single AZ at the same time.
To block a single server from accessing our AZ without affecting the others, we would need a Security Group equivalent to our earlier network ACL. This is harder than it sounds because Security Groups have much more limited capabilities. And every attempt at setting one up required scheduling a maintenance window.
At first, the Security Group failed to allow incoming web traffic, so the ELB marked the isolated host unhealthy and took it out of the rotation. Blocking Kafka proved difficult because Security Groups do not have “deny” rules, and inexplicably the ephemeral port range on our API servers was so wide (5000 – 64000) that it overlapped our Kafka ports.
After a week of try-fail cycles, we created a side-task to investigate the ephemeral port range, and we decided to proceed with a full-AZ outage simulation using the same network ACL we had already used with simulated traffic.
We agreed on an outage of at least 1 minute and at most 5 minutes, and we would revert the network ACL as soon as anything inexplicable happened. The worst-case loss of 1 minute of traffic would represent at most 0.023% of daily traffic. We never lost any traffic during these repeated experiments, but I wouldn’t have missed sleep over having to report that loss to our customers in light of the reliability improvements we achieved in the end.
The initial signs of the test were good; no dropped traffic.

Kafka messages were queueing up, and spooling to disk.

But worryingly, there was only a minimal drop in outgoing traffic to Kafka, and the ELB marked a bunch of hosts “unhealthy.”

If half our hosts are in a simulated outage, we’d expect traffic to Kafka to halve as well. And we do not want any unhealthy hosts.
It wasn’t hard to reason through what was happening from these metrics. Isolated hosts were accepting traffic, timing out Redis calls, and then queueing outgoing traffic. However, the build-up of Redis requests waiting to time out was slowing down the isolated hosts. This slow-down was sufficient for the ELB to decide the hosts were unresponsive and took them out of the rotation.
This meant our simple time-out approach to handling Redis unavailability was inadequate: a long timeout would cause Collectors to get swamped with requests waiting on Redis, but a short timeout would cause errors under normal operation. We decided to upgrade to circuit-breakers instead. Rather than re-inventing the wheel, we spent a day doing due-diligence on ready-made circuit-breakers on NPM, looking for active community and robust source code before settling on opossum.
Rather than waiting up to 750ms on each call, a circuit-breaker tracks failures that occur. If the failure rate exceeds a pre-set level, instead of timing out the circuit-breaker trips and all further requests go straight to the default behavior. After a cool-off period elapses, it will try sending one request at a time to Redis, and as soon as a request succeeds the circuit-breaker will close again and send subsequent requests to Redis.
In our outage scenario, this means when we isolate the AZ, the following steps should happen:
Collectors will temporarily slow down as requests wait to time out.
Redis lookup failures will build up.
The circuit-breaker will trip.
From this point, default handling will bring the response rate back to system-normal.
The next simulated outage went perfectly; all our Collectors remained healthy, all Kafka traffic queued and spilled to disk as required, and circuit-breakers responded efficiently. And after resolving the simulated outage, all received messages reached Kafka, and eventually our database as if nothing had happened.
All in all, we never lost a single message in production during these tests. And now we know for sure that if an AZ goes down, our data capture will continue to catch our customers’ valuable data.
Ephemeral Ports and Slow Redis Commands
Alongside our outage simulations, we investigated and resolved two tangentially related issues.
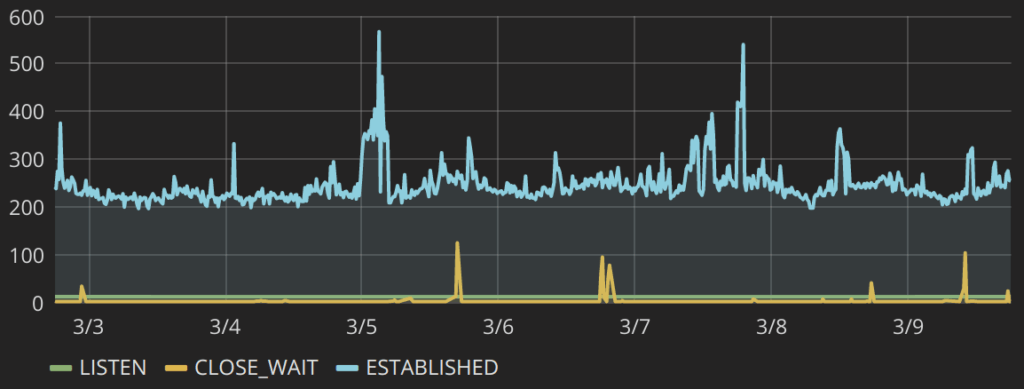
For the unexplained ephemeral port range on our Collector hosts, we implemented some simple port-use monitoring to confirm the hypothesis that we did not need 60k available ports.

And after measuring for a couple of days, we reverted the range on our Collector hosts to the Linux defaults.
We also noticed that even under system-normal our newly implemented circuit-breakers were occasionally tripping. Rather than speculate about the reason we enabled SLOWLOG monitoring on Redis, and quickly discovered there were parts of the system that relied on KEYS and ZREMRANGEBYRANK calls that would take 4+ seconds multiple times a day.
Use of those commands was isolated, and we replaced them all with iterative alternatives instead. Now our Redis command execution time never spikes past 100ms.
Outcomes and Upsides
We achieved what we set out to:
We have improved the system to be reliable under an AZ outage.
We have tooling to simulate an AZ outage, and to generate artificial traffic for testing.
We have a documented script for running the AZ outage scenario so that anyone can do it.
We have a monitoring dashboard, specifically designed to show the graphs that are relevant to the simulation.
But our exploratory approach has also had some unexpected additional benefits that we would not have achieved had we tried to design our approach entirely up-front:
We improved Collector restarts to produce better logging and be more reliable than before.
We reverted unexplained non-standard ephemeral port ranges safely back to defaults.
We refactored some slow Redis commands that were causing latency spikes.
If you decide to do this kind of work, you should expect to iterate on your testing rig as much as the improvements it surfaces. One of our most important learnings from this project has been that discovery happens in both areas.
Another key learning has been that the durability improvements we made go way beyond the initial scope. We set out to ensure that we were robust to either of our Availability Zones going down, but by adding entropy to the system we exposed a lot of fragilities that weren’t at the Availability Zone boundary. We isolated ways Redis slowness could cause instability and made ourselves robust to them. We rooted out causes of Redis hangs elsewhere in our product and banned some of the problem-prone Redis commands. As a result of this project, our data collection is much more robust within each Availability Zone, as well.
Between the implementation of circuit-breakers and refactoring of slow Redis commands, something wonderful happened to our 5xx graphs under system-normal conditions as well:

We used to have routine bursts of 10k+ lost events. This was a small enough fraction of total traffic that it didn’t materially affect analyses, but it still required regular investigation, resolution, and customer communication. Now it’s rare us to drop even 100 events.
Before this implementation, we used to get on average 8-10 PagerDuty alerts per month for Collector issues. Typically they were short flakes that lasted less than a few minutes, which were maddening for engineers. Since completing this work on December 13th, we haven’t had a single data collection page; as of this writing that is 100 days and counting!

I hope this inspires you to break your system a little bit at a time. An agile and iterative discovery of what needs improving will likely give you better outcomes than you could achieve through careful planning.
Please reach out on Twitter; I’d love to hear your own API hardening stories! And, if you’d like to help us make our system better by breaking it, head over to our jobs page. We are always looking for more smart engineers that don’t like assumptions.
