4 Key Facts You Should Know Before Allocating Ad Spend
There’s a lot to pay attention to when you’re running an online business. In addition to tracking inventory, shipping items, and managing clients, you want to make sure you’re spending your energy advertising on the right sources. Trying to figure out exactly where all your traffic is coming from, and which source of traffic is most likely to actually purchase something, is extremely valuable information.
At Heap, we collect this data to help online businesses drive customer acquisition. Our analysis platform typically helps businesses understand how their own ad campaigns are performing. For the first time ever, we’ve aggregated this data across a diverse set of eCommerce businesses and released our findings publicly. In this analysis, we looked at over five million anonymized website visits across several companies to see which advertising channels had the highest conversion rates and which drove the most traffic.
Would social media websites drive more traffic than search engines? Which websites have a higher conversion rate from visitor to customer? Does the average shopping cart size affect the conversion rate?
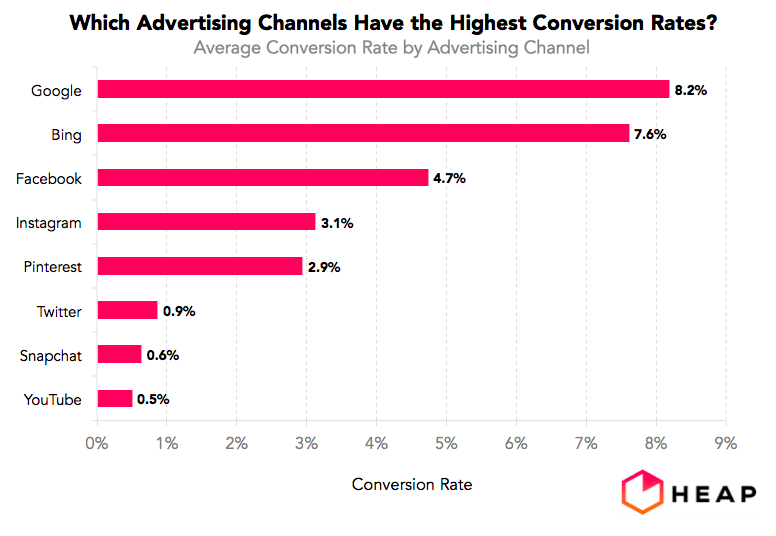
Ultimately, we found that search engines like Google and Bing had the highest customer conversion rates, at around 8%, a conversion rate over 1.5 times higher than Facebook’s.
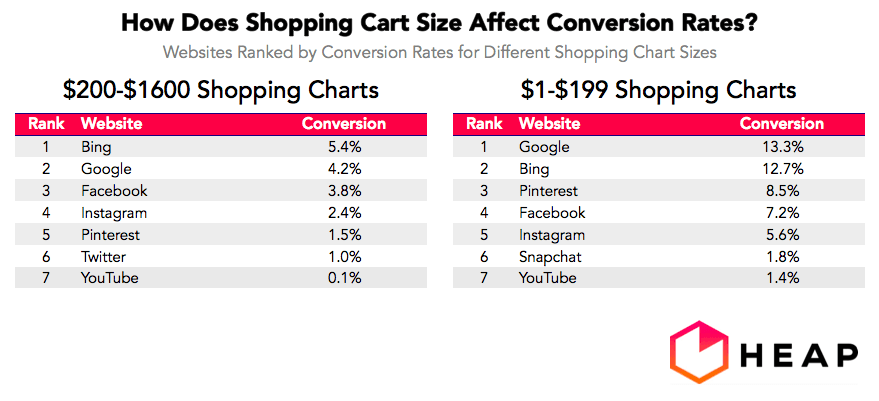
Shopping carts that were less than $200 had higher conversion rates than larger shopping carts across all websites. Google had the highest conversion rate for purchases that were less than $200, while Bing had the highest conversion rate for purchases that exceeded $200. Lastly, social media like Facebook and Snapchat drove the most traffic, accounting for between 13-14% of website visits, but also had the lowest conversion rates.
We started our analysis by investigating what websites had the highest conversion rates. To do this, we looked at the average percentage of visitors to a website that ended up purchasing something during their visit.
1. Search engines have the highest conversion rates
blog-advertising-channels

When we look at conversion rates, Google comes in first, with a conversion rate of 8.2% on average, followed closely by Bing (7.6%). Though Facebook comes in third for conversion rate, its conversion rate is one-third less than Google’s. Twitter (0.9%), Snapchat (0.6%), and YouTube (0.5%) have the lowest conversion rates.
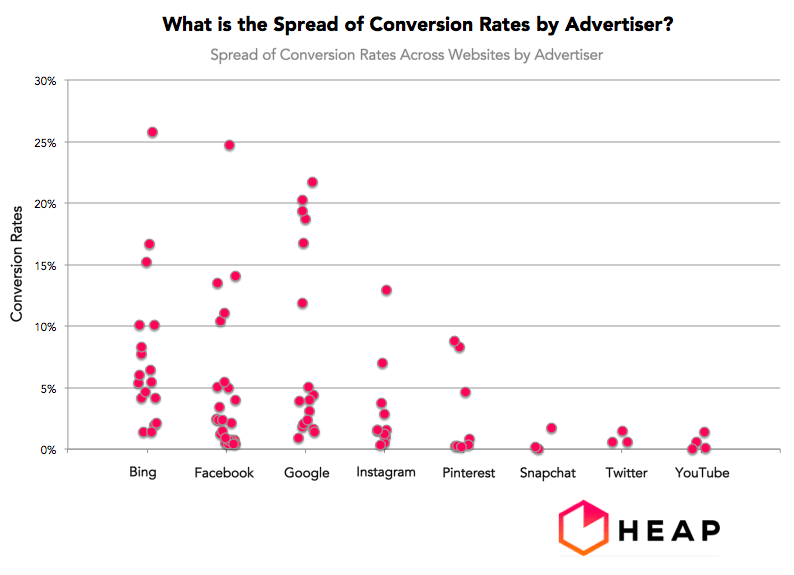
We all know that conversion rates vary. What we have been looking at is the average conversion rates by website source. We wanted to know what the spread of conversion rates were for each source, so we created a plot to look at how variable conversion rates are across websites.
2. Conversion rates vary substantially within a source

Our last chart shows that the conversion rate varies quite a bit within each advertising source. While Google had the highest conversion rate on average (8.2%), looking at the spread of scores we can see that both Bing (average 7.6%) and Facebook (average 4.7%) outperform Google for some websites. However, the overall trends, with Facebook, Google, and Bing vying for the top three places, hold when we look at the spread of scores. Generally, these three sources will drive higher conversion rates. Fewer websites used Snapchat, Twitter, and YouTube, perhaps because it is hard to monetize these sources.
So what is behind this spread in conversion rates? We wanted to dig into how other variables, such as shopping cart size, affects the conversion rate across websites. Some websites may rely on selling items that are more expensive, while others rely on multiple smaller transactions. We decided to investigate whether shopping cart size (how much customers pay in the end) had an effect on conversion rates.
3. Larger shopping carts have lower conversion rates

The size of the shopping cart affects both the conversion rate and which source has the highest conversion. If we just look at the highest conversion number for large (5.4%) and small (13.3%) shopping carts, we see that smaller shopping carts have a conversion rate on average that is approximately 2.5 times higher than large shopping carts.
If we just look at the large shopping carts ($200-$1,600) Bing comes out on top, with a conversion rate of 5.4%, followed closely by Google (4.2%). Twitter (1.0%) and YouTube (0.1%) have the lowest conversion rates for larger shopping carts.
When we look at the smaller shopping carts ($1-$199), Bing drops to second place with a conversion rate of 12.7%, and Google moves to first, with a conversion rate of 13.3%. YouTube remains at the bottom (1.4%), and Snapchat joins the lower part of the list in 6th place with a conversion rate of 1.8%. We should note that there was not enough data on Twitter for smaller shopping carts, and not enough data on Snapchat for larger shopping carts. Pinterest makes the largest increase in conversion rates between the large to small shopping carts, from a conversion rate of 1.5% to 8.5%, which is over a five-and-a-half fold increase in conversion rates.
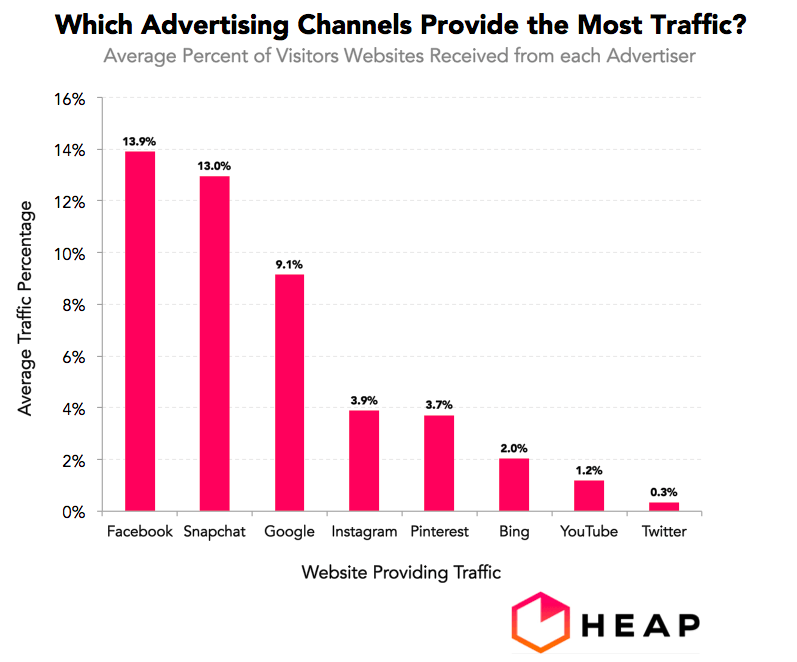
For our last set of analyses, we wanted to see how the conversion rate data compared to overall traffic trends. Google and Bing have been at the top for conversion rates, but do they also drive the most traffic to websites?
4. Facebook and Snapchat drive the most traffic to websites

It turns out that Facebook (13.9%) and Snapchat (13.0%) drive the most traffic to websites. Google comes in at a close third (9% of traffic), with a sharp drop in traffic from the rest of the referral sites. Twitter (0.3%), YouTube (1.2%), and Bing (2.0%) drove the least amount of traffic to companies.
It will be interesting to see how Facebook’s revamp of users news feeds affects traffic and conversion rates. Will the result be less traffic from Facebook, compounding the lower conversion rate?
Using over five million website visits tracked using Heap, we were able to look at what advertising sources drive the most traffic and have the highest conversion rates. We found that search engines like Google and Bing had the highest conversion rates, with 8.2% and 7.6% of customers purchasing something. When we looked at the spread of conversion rates by source, the average trends held, with Bing, Facebook, and Google providing the highest conversion rates. However, in some instances, Bing and Facebook were able to outperform Google’s average conversion rate. We also found that the size of the shopping cart affects the conversion rate; smaller shopping carts ($1-$199) had conversion rates of up to 13.3%, while large shopping carts had conversion rates up to 5.4%. Typically, it’s easier to make smaller than larger sales. Finally, we found that social media websites like Facebook and Snapchat drove the most traffic to websites, driving as much as 14% of a website’s traffic.
Additional resources:
