Heap Using Heap: Planning Our Product Roadmap with Data
Most analytics problems are data problems. Business users struggle with questions like: Is this event tagged? Is this event tracked correctly? What does this event even mean? Our goal at Heap is to automate these processes so users can get insights faster.
In this series of blog posts, we’ll walk through concrete examples of how we use Heap to inform our own business and product strategy. Our first post is about using Heap to help with product roadmap planning.
You can’t build a product without understanding your users. (Well, technically, you can, but you might not be around very long.) Before we started planning and prioritizing Heap’s 2017 roadmap, I wanted to understand how people use Heap. Are users actively exploring data, or mostly consuming prebuilt reports?
This is important because these two use cases have very different needs. Explorers need features that increase the complexity of our analysis tools and make it easy to explore the same data in different ways. Consumers, however, need tools for collaboration and ways to digest multiple sets of information easily.
We want to have the correct balance of features and prioritize them according to our users’ needs. Here’s how I determined who uses Heap (and how they use us), to inform our product roadmap planning.
What’s the breakdown between active and passive users?
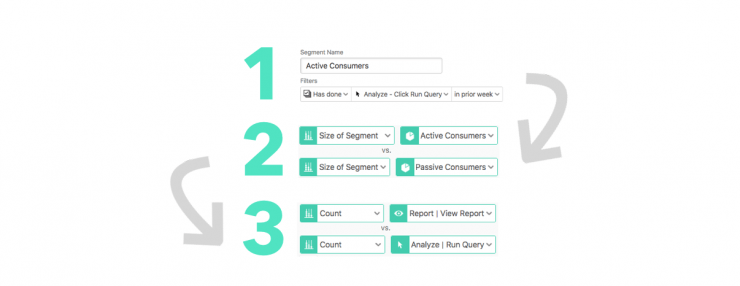
To answer this question, I first need a working definition of what it means to be an active or passive user in Heap. I also need to identify the subset of users who fit these criteria. To do this, I defined two user segments, one for each user type.
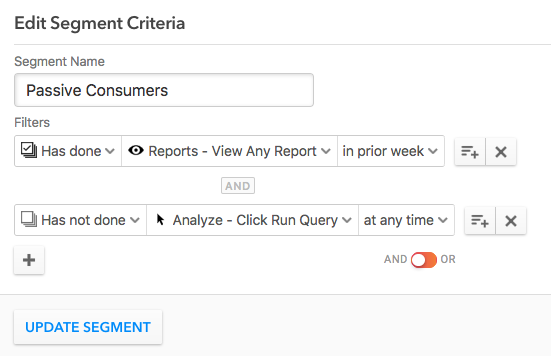
My first segment consists of passive consumers who view reports and never run queries, but are still frequent users of Heap (viewing reports at least once per week). We can define their segment directly in Heap:
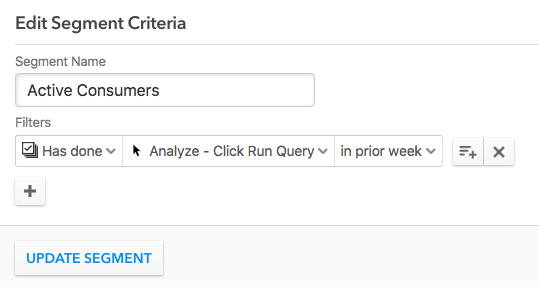
Active consumers, on the other hand, run their own queries, like modifying a report or doing ad-hoc analysis, on a somewhat regular basis (running queries at least once per week). Here’s how we’d define that group in Heap:
With our Graph tool, I compared the size of these two segments to understand how their membership changes over time.
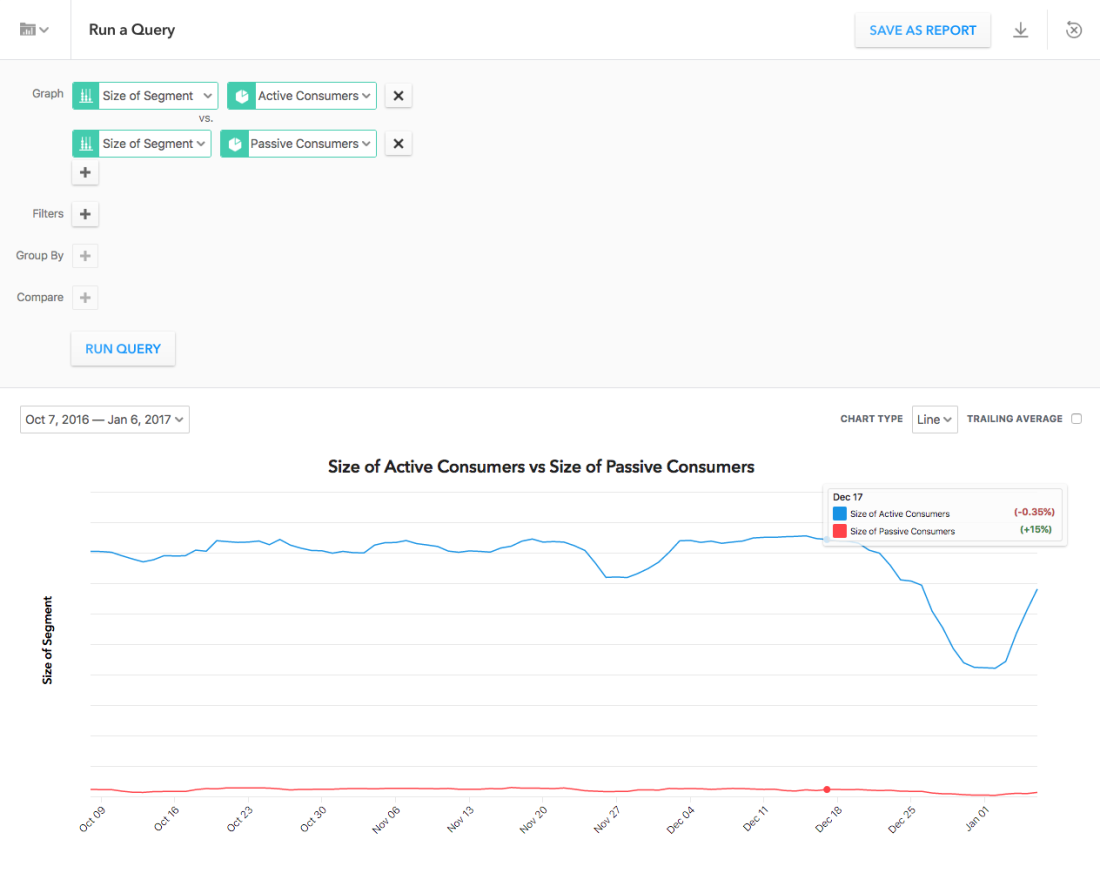
Conclusion: Most Heap users are actively digging into data. Looking at this graph, you’ll notice that there are more or less no users who fit the passive consumer extreme. At some point in their history, people start to run their own queries and explore their own data. They don’t just consume data.
This discovery led me to my next question.
How active are our active users?
After determining that the majority of users perform their own analysis, I wanted to determine how often they view reports vs. explore data. Hypothetically, a user could be viewing ten reports and exploring one graph, or vice versa.
Using Heap’s Graph tool again, I compared the number of times users view reports vs. the number of times users run queries. I applied a trailing average here to view the trends in the data.
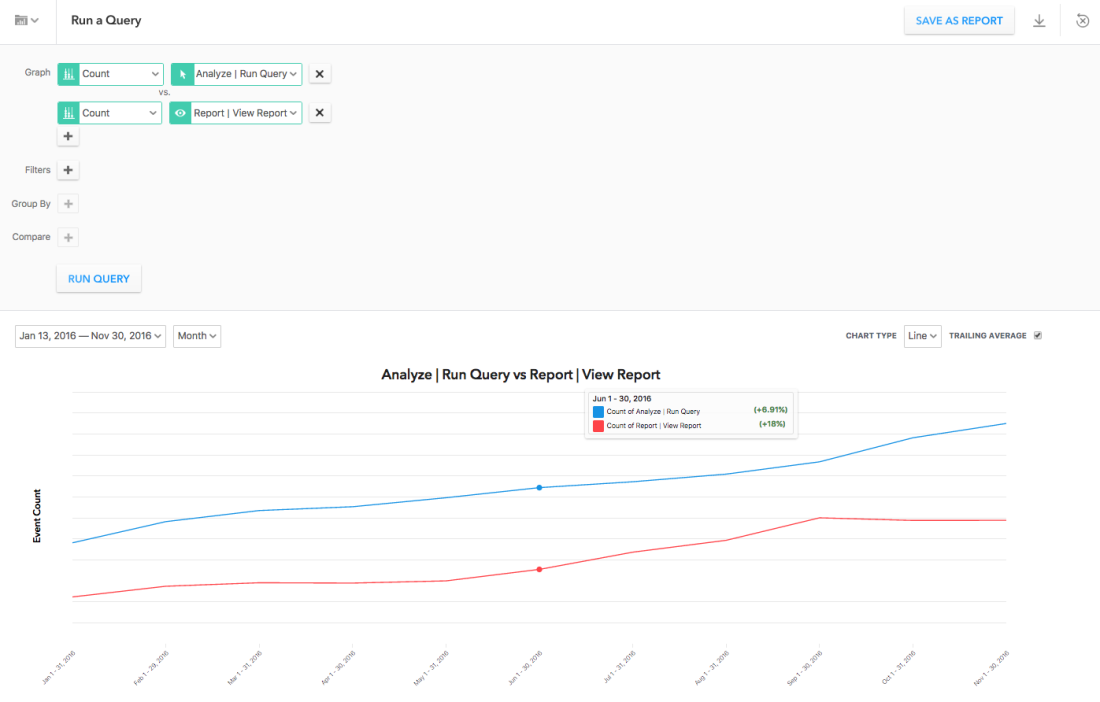
Conclusion: Users do exploratory analysis more frequently than they view existing reports. Looking at this report, we can tell that most of the time, users are actively running queries, whether they’re modifying an existing report or diving into new analysis.
What’s the distribution of activity across active and passive users?
Although the number of times the event occurs clearly trends to exploratory analysis, this doesn’t give me a complete picture quite yet. We don’t know the distribution of queries, and this report could just reflect a few extremely active users. This would mean that the event counts alone would be biased towards one type of user.
To get more clarity, I used a graph to measure the total number of users who have viewed reports vs. the total number of users who have run queries.
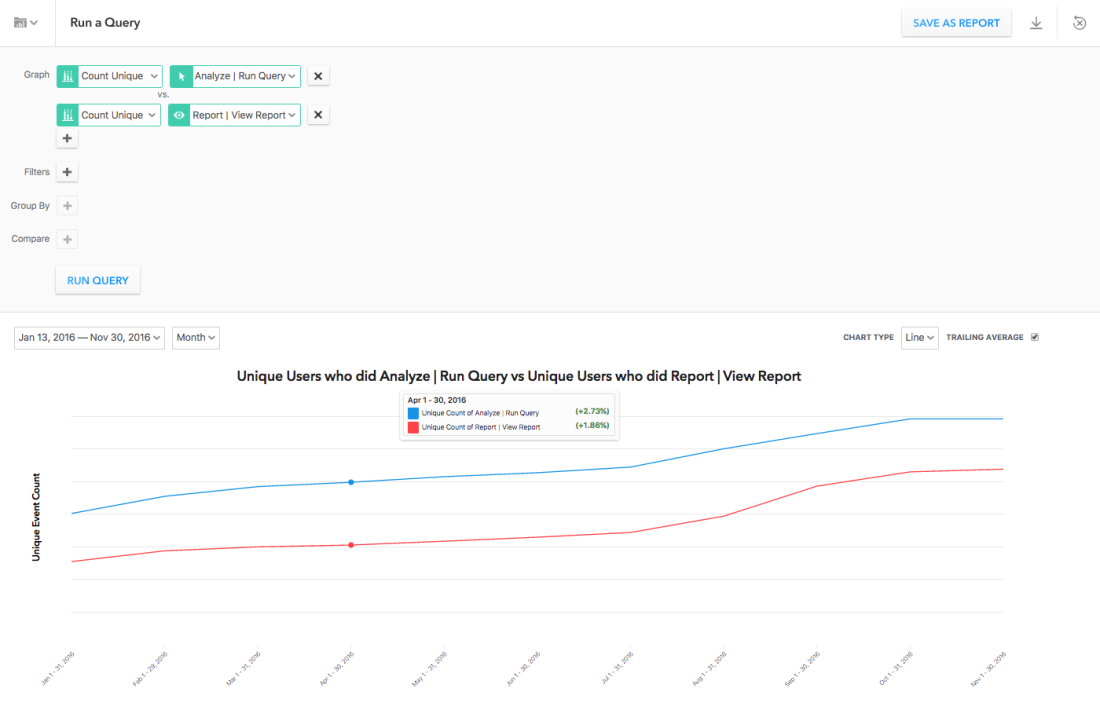
Conclusion: More users run analysis than view reports. The split between passive consumption and active exploration remains fairly constant, with the majority of users actively running queries in Heap.
How do I apply this knowledge?
This analysis gives me two things:
Knowledge to inform roadmap prioritization decisions
A new set of questions about usage to explore:
Are people mostly editing existing reports or starting from scratch?
How much work does a user need to do to explore their data?
Which types of analysis are used for consumption vs. exploration?
How many filters, events, or group by statements are people using in their analysis? (see below)

Now that I have this knowledge, how do I turn it into actionable insight? How do I apply these metrics to prioritizing our roadmap? It’s tricky, and this is where analytics involves art and becomes more than just a science.
There are multiple ways that we can interpret and act on this data:
Hypothesis 1: We should double down on the active user.
Heap enables users to explore their data, to dive in and answer questions as they arise. For our users, this is arguably more valuable than looking at static reports. When designing our roadmap, we should focus on building features that enhance exploration, give users the freedom to ask more complex questions, and make it easier to access data.
Hypothesis 2: We should focus our roadmap on collaboration and passive viewers.
Heap is not a static dashboarding tool, so our users use Heap for what it’s best for: actively engaging with data. When designing our roadmap, we should focus on including more features that allow users to share and consume data passively.
So, where do we go from here? Stay tuned to our feature updates to see which product decisions we’re making based on this data! In the meantime, try performing the same analysis in Heap and see where it leads you. Log in or sign up for free and start analyzing in seconds.
