PM Best Practices: Are you learning from every launch?
Why After-Action Reports are Important
Product launches are always fun. They’re like Christmas for your users, and you get to be Santa. But while it’s rewarding to drive the sleigh and drop off presents, it’s even more important to use launches to figure out how to evolve your product strategy. At Heap, we do this through a process called After-Action Reports.
Briefly, After-Action Reports are organized reports we write every time we ship a new feature. We find the experience amazingly useful for developing our products and staying agile as we figure out what works. We believe that it’s crucial for Product Management organizations to maintain these activities, for a few reasons.
It enforces accountability for PMs — Engineers are accountable for delivering functional, quality code on time. Salespeople are accountable for generating revenue. Why shouldn’t PMs be accountable for their decisions?
It increases agility — It’s easy to fall into a quarterly planning cadence that doesn’t promote an environment of constant learning. Creating a practice of following-up after each product change helps you reach more informed decisions, faster.
It celebrates learning — Product development works best when it’s run as a series of educated experiments. Seen this way, even failures can be celebrated as opportunities to learn. (At Heap, for example, we share our reports with the whole company!)
Anatomy of an After-Action Report
Ok, so you’re committed to reflecting on your new release. So what should this reflection look like? At Heap, we include the following in all of our AARs. (After describing the AAR process, I’ll include an example of an actual AAR from a recent launch.)
What did we ship?
For people who don’t have context on your project, provide a quick reminder of what you added or changed in your product.
What was the timeline?
Spell out how long it took you to move from plan to release. This serves two purposes: (1) it gives yourself and stakeholders a clear idea of how much engineering time you invested in this launch, and (2) it highlights process issues or unforeseen delays that might have prevented you from getting the product to market as quickly as possible.
What was our hypothesis?
Here you clarify the assumptions you had about the problems that customers were facing and why you thought that the solution you built was going to solve the problem. It is also very important here to outline the user behavior metrics you thought your experiment would move, and in what direction. This keeps you focused on the metrics you want to measurably improve, and keeps you from rationalizing shifts in KPIs after the fact.
What was the result?
This section is the meat of the After-Action Report. In it and we make sure to provide 3 types of information:
Shift in KPIs: Whenever we start a project, we write a Product Brief that describes the problem we are trying to solve, why we are solving it, and what user stories we expect to enable in our product. As mentioned before, we also determine the KPIs we will use to measure success, and establish the baselines for those KPIs. In this section, you simply compare your pre-launch baseline to your new measurements, and call out the major increases, decreases, or “neutral” or unclear impacts.
Anecdotes and customer quotes: Did we get any specific praise or negative feedback from customers? Were there any particularly notable success stories? This is helpful in some cases to provide more context, but more importantly it humanizes our work — there are real people using the things we make, and it’s important not to forget that!
Deep dive into changes: In general, it is very unlikely that you will know the full impact of a product change before you actually ship that change, so it is critical that you are able to formulate and answer new, unplanned questions on-the-fly. I make extensive use of Heap for this because behavioral insights sit on top of an auto-captured, retroactive dataset. This means that I can “define” a new behavioral event and automatically access the historical click data associated with that event, instead of waiting weeks to get an answer. There are a few questions I generally like to answer when diving deep into the impact of a launch:
How discoverable was this feature in the product? You can answer this by looking at the number of users who see any of the entry points to your feature.
Did users actually discover your feature? You can answer this by using a funnel with an event that denotes viewing any entry point to your feature and an event that denotes starting to use the feature.
Did users make it though the feature successfully? You can answer this by making a funnel that includes an event that denotes starting to use the feature and an event that denotes successfully completing a workflow with the feature. The more steps you have in between, the higher resolution you get on where users might be running into roadblocks.
What impact did the feature have on product retention? For a SaaS product, there are usually one or more value-driving actions (strong signals that users are getting value out of your product). An easy way to understand if your launch helped improve retention is to graph retention of these value-driving actions, broken-down by whether or not the user successfully completed a workflow with your feature. An improvement results in a retention curve that is shifted upward.
Conclusions
What did we learn from the market? Contextualize your learnings from this launch in your overall strategy — did you solve the broader problem or make progress but discover that there are more aspects to the problem than you originally realized? What next steps does this imply?
How can we improve?
Take note of any process changes that you want to make as a result of this launch.
As Product Managers, we’re responsible for knowing what about our products is working and what isn’t. At Heap,we believe that constant experimentationis the way to learn the most about the products we’re putting out into the world. We also believe that we should squeeze every possible drop of knowledge from every experiment we run!
If you’re interested in following best practices for Product Management, we highly encourage you to make After-Action Reports an integral piece of your toolkit.
Case Study: Suggested Reports
As an example, I’ll go through our After-Action Report for Suggested Reports, a feature we launched this summer at Heap.
What did we ship?
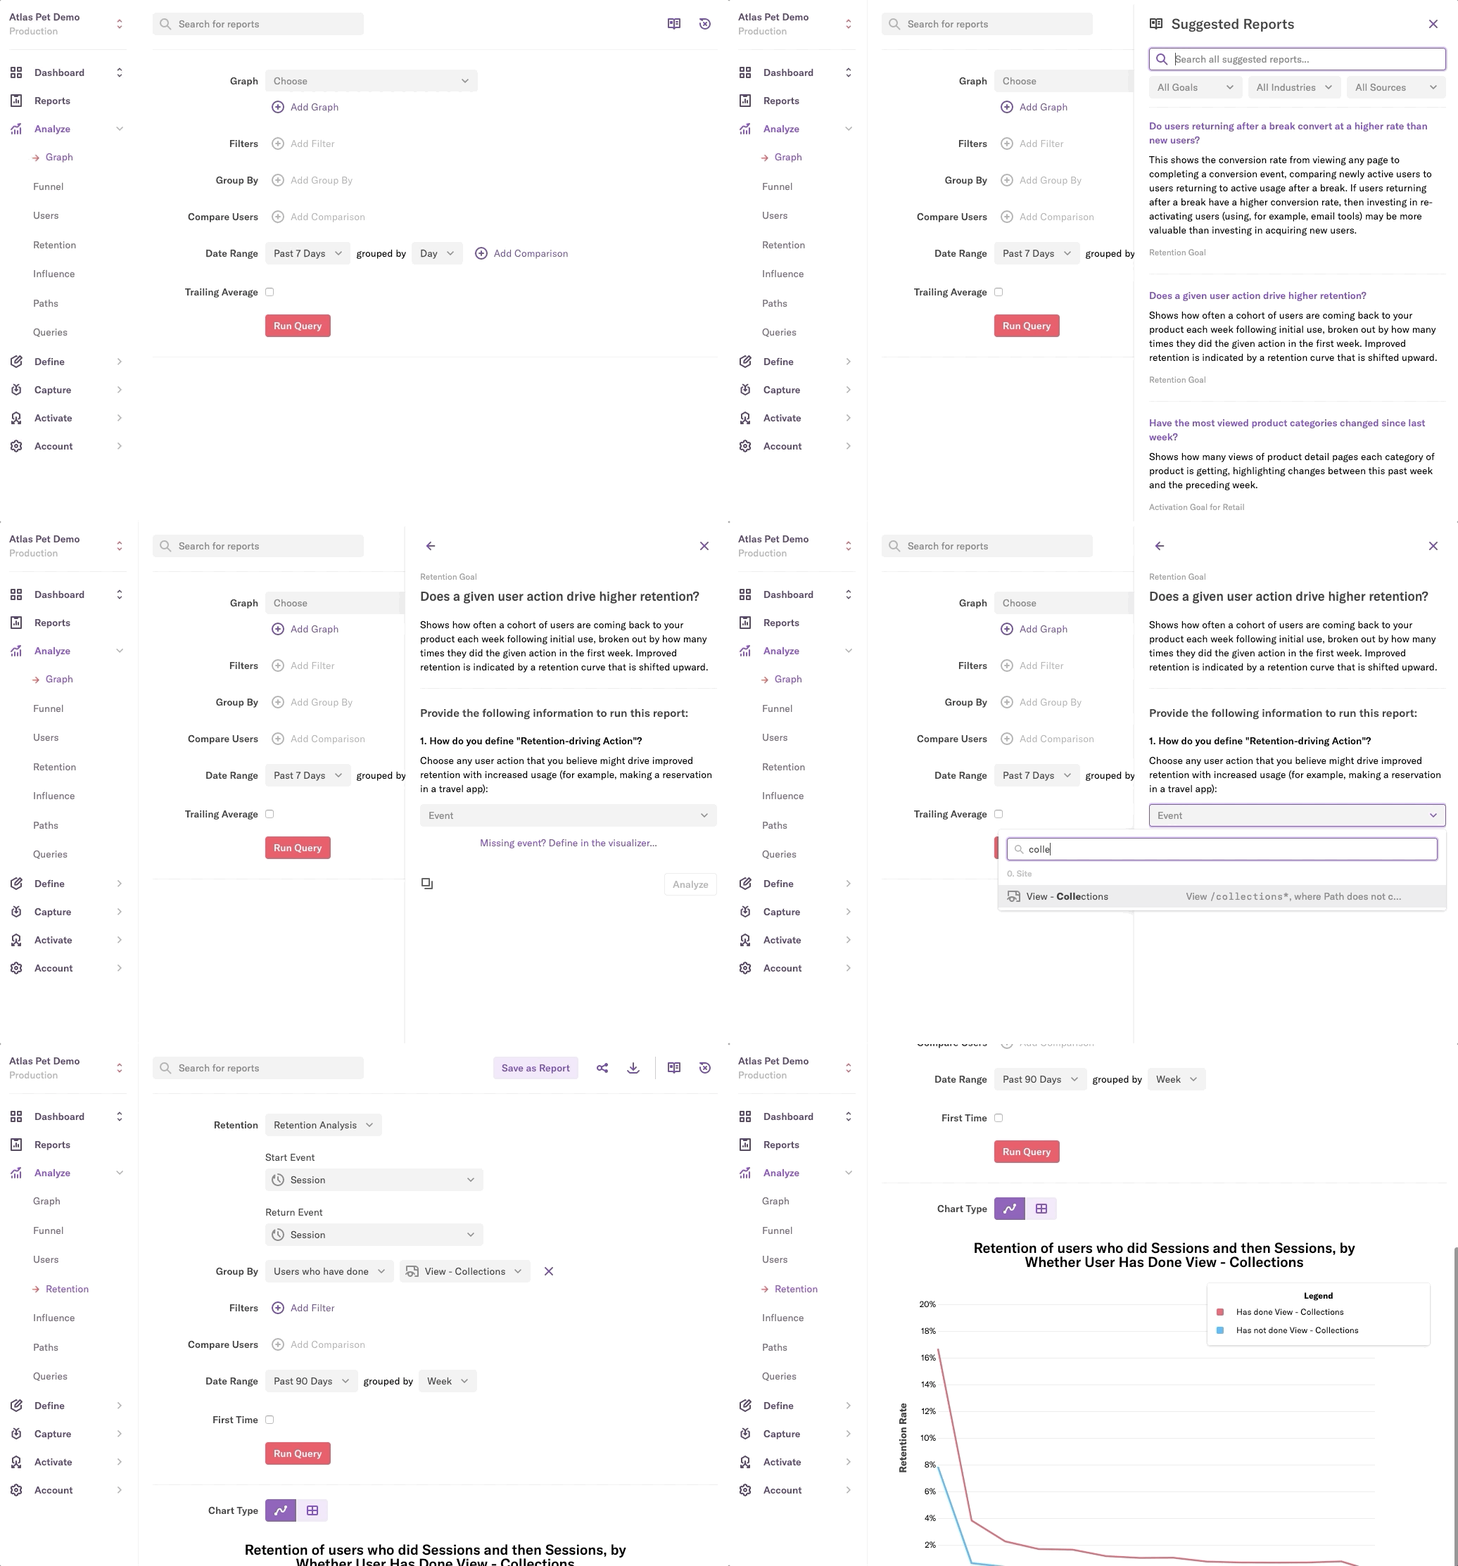
Suggested Reports are a set of templated analyses that help users easily discover and answer questions in Heap.
Here’s what the feature looks like:

Example of suggested reports in Heap
What was the timeline?
With 1 engineer working on the feature, we invested ~6 engineer-weeks from Engineering Kickoff to Beta. One highlight was getting to the point where we could do an interactive user test in under 2 sprints.
What was our hypothesis?
For Suggested Reports, we believed that our customers didn’t clearly see from Heap’s UI what questions they can answer in Heap, and that it was hard for our customers to use Heap’s query builder (the query builder has lots of options, which can make it difficult for users who aren’t literate in SQL).
At Heap, the “active usage metric” that we optimize for is the number of weekly querying users. Our hypothesis was that by putting plain-English questions front and center and auto-filling queries to match them, we will help solve these problems and drive increased usage.
What was the result?
Shift in KPIs:
Decrease in the % of managed accounts with low usage (0 or 1 weekly querying users)
Increase in the % of users who run a query in their first week
Insignificant change in the % of users who save a report in their first week
Insignificant change in the % of users who define an event in their first week
Anecdotes and customer quotes:
One of my favorites (both complimentary and constructive): “They are extremely useful at educating me on what and how to analyze. I wished I was guided more and they looked more like the magic items they are.”
Deep-dive into changes:
How discoverable was this feature in the product?
There were two entry points to Suggested Reports — a “Reports” page with existing reports saved by Heap users (but not a destination to ask new questions) and a slide-in panel in our “Analyze” views, where users are actively asking questions.
About 70% of our weekly logged-in users would see the Reports page, and about 55% of weekly logged-in users visit our “Analyze” pages. This gives us a good baseline upper bound for how much usage we could have expected from users organically discovering the feature.
Did users actually discover your feature?
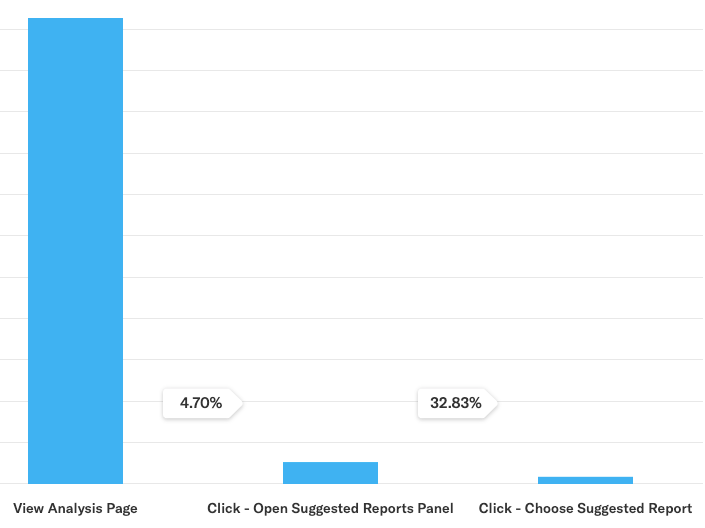
Turns out… NOPE! Only 10% of users who could discover Suggested Reports ended up actually starting to use it. Let’s break this down further by entry point.
About 13% of the users who saw the Reports page started creating a Suggested Report, while only 5% of the users who saw the Suggested Reports panel opened it. However, 33% of those users successfully started using the feature.

Example feature discovery analysis in Heap
This suggests that we either placed the feature in an area that didn’t resonate with the immediate need (the Reports page), and we can get some gains in usage by making higher-performing entry points more visible in our product (e.g. automatically popping out the Suggested Reports panel). Room to improve in future iterations!
Did users make it though the feature successfully?
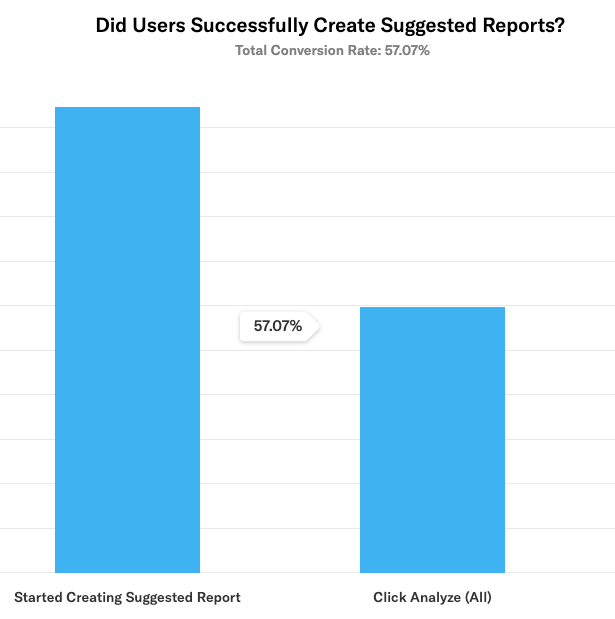
For Suggested Reports, we found that ~57% of users who started creating a Suggested Report successfully ran a query. This could be improved, but overall was within an acceptable range (our baseline query completion rate was ~77%, and its likely that some users would poke into a Suggested Report only to realize they don’t have all the data they need to run a query).

example chart of feature interaction in Heap
What impact did the feature have on product retention?
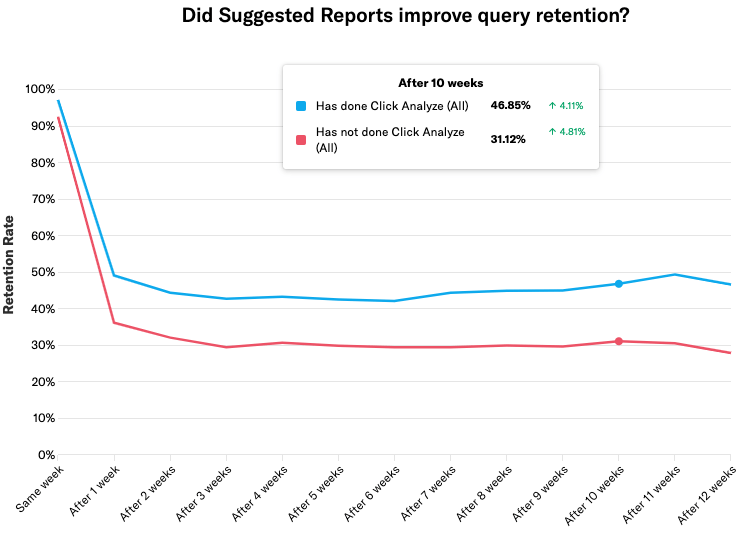
Most SaaS companies have annual or monthly contracts and usually use active usage of some key “value-driving” feature as a proxy for customer health. In the case of Heap, we provide insights in response to queries, so the value driving action we care about is running queries (this will likely evolve over time to be even more closely tied to insight). We found that users who had successfully run a query with Suggested Reports had a 50% higher weekly query retention rate at 10 weeks vs users who didn’t. This is a huge win, and suggests that if we made this feature more prominent, we’d likely see a big impact on long-term retention and consequently active usage.

Visualization of did suggested reports improve query retention
Conclusions
For Suggested Reports, we learned that suggesting questions to ask is helpful, but part of a bigger puzzle that includes knowing how to successfully choose what events to measure. As a next step, we’ll be investing in making Suggested Reports more prominent in Heap’s UI and in making it easier for new customers to get set up, define the right events, and navigate to the right analysis modules in our product.
How can we improve?
For Suggested Reports, we didn’t actually look at the baseline of how many users would be exposed to the feature before we launched, even though we were fully capable of doing this (and doing so would have possibly changed some of our decisions about where to place the feature). From now on, we are going to add feature discoverability baselines in the design phase of any new feature so that we can make more informed tradeoffs of placement within our product.
Looking for an example of an easy-to-follow after-action report? We’ve got you covered! Download our after-action report template here.

