What's Heappening
10x Faster Queries
Our favorite part of Heap is the ability to define events and users cohorts post-hoc. This makes it much easier for us to ask arbitrary product questions on the fly and answer them in real-time.
So in order to further optimize Heap’s feedback loop, we’ve spent a considerable amount of time optimizing our query engine. We have been able to cut down query execution times by a factor of 10, and average query times are currently well below 400ms. Our performance goals are:
50% of queries must finish in <250ms
90% of queries must finish in <1s
99% of queries must finish in <3s
Try it out! Digging into data should in general feel much, much snappier now.
Event Feed Trends
"We know there are known unknowns; that is to say, we know there are some things we do not know. But there are also unknown unknowns – the ones we don’t know we don’t know.” – Donald Rumsfeld
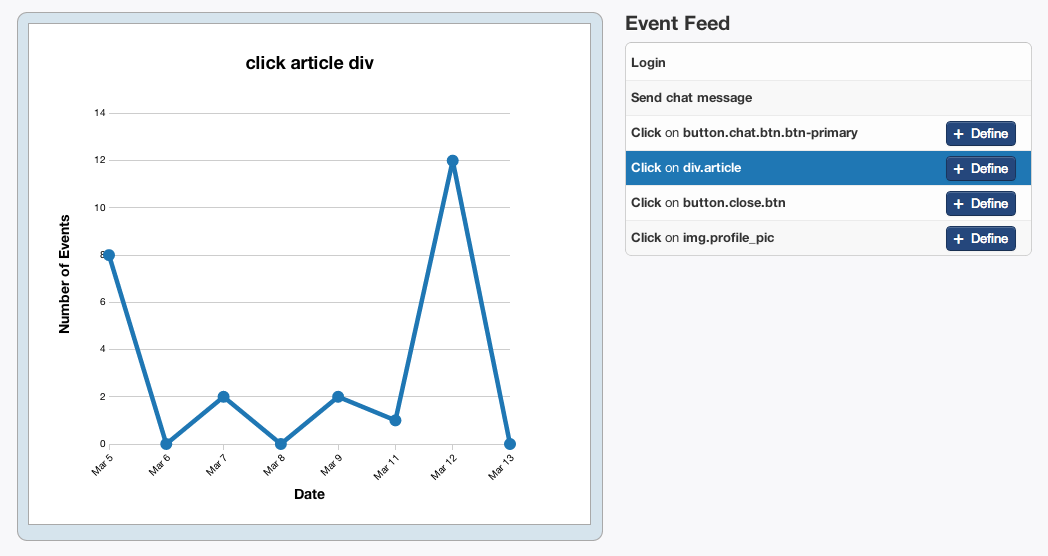
Our newly revamped Event Feed is a first step in solving the perennial issue: how can I make sure I’m asking the right questions? The new interface automatically displays trends for the most meaningful client-side events performed by your users, so that any anomalies will visually pop out at you.
Notice sinusoidal behavior in event A? Is there a dramatic decrease in event B? Just tag the event in question, and you can start running segmentation on it without any delay. And of course, all of its past history will automatically be waiting for you.

Custom API
We are offering a client-side API for logging custom events and user properties. Once these properties are logged, you can query them in exactly the same fashion as any other property or event.
heap.identify({name: ‘Frieza’, gender: ‘no idea’, age: ’50’})
The interface should be reminiscent of other event-based tracking tools, but with the added benefit of Heap’s more flexible querying engine. Want to list all users who’ve paid you >$100? Or defeated 3 monsters but haven’t completed level 4? It’s all just a quick query away.
If we’re doing our jobs properly, you’ll need to rely on the custom API less and less over time.
Data Pivoting
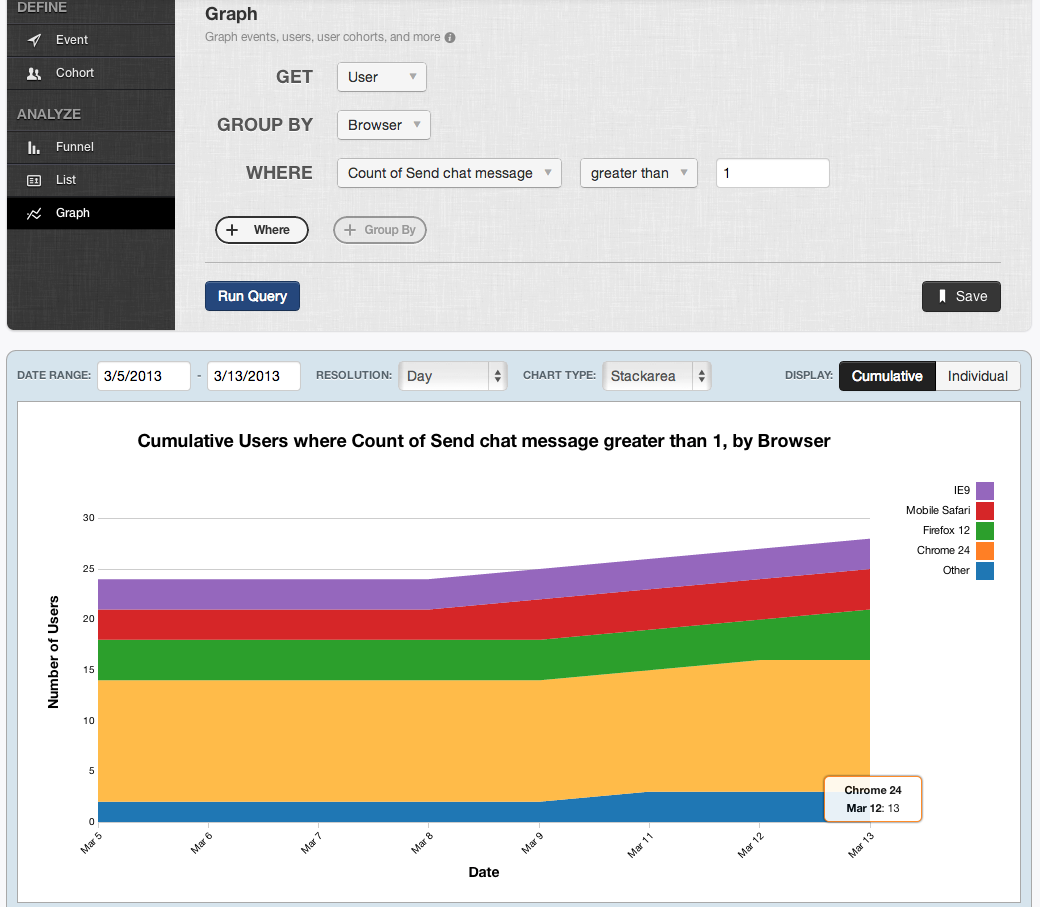
We’ve built a nifty new view that lets you quickly slice n’ dice the results of a given query. Switch from stack area graphs to bar charts to tables. Expand the time range or hone in on a particular date. Split a cumulative view into individual buckets. Granulize results even further. Visualize your data however you choose.

