5 Stupid Things People Do with Self-Service Analytics -- And How to Prevent Them
It’s better when you can do it yourself, right?
That’s the opinion many organizations have about self-service analytics. Why bother the IT guys when you can unlock your own insights? Why wait for the sales reps when you can filter data to generate reports on sales dips and trends yourself? Today, analytics and data discovery technologies are allowing users to work with data without the usual supervision by business analysts and IT managers.
However, as the reliance on self-service analytics has grown, so too has the possibility of error, of overlooking the big picture, or of the analysis process being mismanaged. There’s more to analytics than the ability for a smart marketing manager to pull the numbers she thinks she needs to understand about lead generation, campaign performance, etc. A crucial component is asking the right questions in the first place, and understanding what that means in the context of analytics.
The danger is that those intuitive, easy-to-use self-service technologies will lull users into overlooking what matters as they deploy applications far and wide. So what should you be wary of when going down the self-service route?
In this post, I’ll share five stupid things people do with their self-service analytics and what you can do to prevent them from happening in your business. Give them a read so you won’t have to spend precious hours of your day fixing poorly conducted analyses.
1) Deploying Platforms in Isolation
Self-service analytics will never make their way into the daily workflow throughout the organization if decision makers can’t access them from the applications they’re already using. As a result, people that deploy self-service tools in isolation can make the installation and onboarding seem like an intimidating slog to add to end users’ To Do list. The more effort it seems like it will take for someone to use a new tool, the less likely the tool is going to be utilized well or at all.
Fortunately, self-service analytics can integrate directly with technologies like BI tools, customer data platforms, and CRM systems. If more analysis is needed, users can gain further insights by drilling down at a granular level in the analytics tool itself. Additionally, mobile applications let users take their analytics with them wherever they’re headed. Both mobile and integrated analytics remove the roadblocks preventing self-service adoption. Unobtrusive embedding capabilities take users out of the crowded tool-strewn streets to a self-service joyride on the open highway.
2) Choosing Visualizations Based On Their Aesthetic Appeal
To quote famed data visualization expert Edward Tufte, “There are two goals when presenting data: convey your story and establish credibility.” One of the most common self-service analytics mistakes is failing to do this, by selecting chart types based on your aesthetic preference rather than on the character of your data.
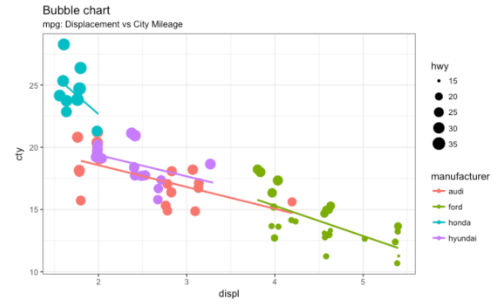
Each analysis requires a different visualization. For example, if you want to display a correlation between two metrics, it’s better to use a scatter chart that can clearly showcase the relationship at a glance. Here’s an example of placing aesthetics over information. The bubble chart below fails to clearly show a relation between the number of engine displacements and city mileage. The annotation method is also rather weak. A simple bar chart may be less pretty, but it would more clearly communicate the information.

The best way to prevent such errors is to define your goals first. What are the relationships between the metrics you want to analyze? How much data do you need? Every self-service analytics strategy should answer specific business concerns and questions. Additionally, you should opt for straightforward visualizations to deliver quick, relevant, and accurate answers, so use your good judgment to sift through the available analyses and visualizations, and choose only the points that can provide meaningful insights. When you have your goals defined, your path becomes clear.
3) Implementing Procedures Without Standardized Guidelines
Self-service analytics is exciting. When an organization begins its journey into the world of self-service analytics, it is common for analytics and BI teams to create a lot of reporting UIs, data definitions, and one-off metrics. The problem with this is that it gets messy fast and leads to overlapping functions and data. To create ease of understanding and consistency in the future, ensure that you’re building a set of standards that every stakeholder adheres to. Here’s an example of what you don’t want: two different users execute the same function, but name each of their efforts to a different process. They end up with an analysis of two different metrics for the same outcome – which can endanger a lack of trust between them and their peers.
Issues like these can be easily prevented through the creation of standards. For example, you can store lineage standards and data definitions in a “digital hub”, which is accessible to all teams and queries. Each element added to this hub should contain information about where each data point was sourced, any changes applied, and any other information for the use of others. Similarly, UX standards can be set up to make the look and feel of reports consistent. Making the process look and feel more standardized will help your users quickly interpret multiple data sets rather than having to relearn the base of each new set. Overall, users’ analysis will be quicker and their results of a higher quality.
4) Sticking to Waterfall Methodologies from Start to Finish
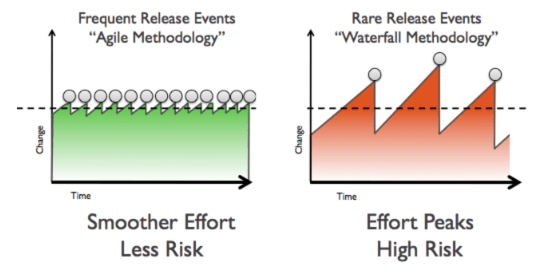
Many organizations adopt the waterfall methodology while they’re democratizing analytics and BI. That is usually a mistake. Waterfall development is one of the critical reasons why tasks take too long and fall short of providing value. Also, longer waterfall cycles carry the risk of transitioning into bad code and application design mistakes that remain undiscovered until the project’s end. Agile methodology offers a more viable solution. Agile development methods include shorter, incremental cycles, which allow malfunctions to happen first so that mistakes can be identified and fixed more quickly.

Agile development methods can be an ideal fit for many business applications where continuous refinements are expected. They’re particularly handy where applications need to consider new requirements and new data. If your analytics’ projects are moving slowly, you should analyze whether the traditional waterfall approach is the cause. The next step is to consider whether agile might be the right fit for your goals to expand analytics and BI throughout your organization.
5) Going at It Without Data Governance
Self-service analytics don’t mean that you’ll have a free-for-all scenario. Data governance is essential for balancing an organization’s need for analytics access with IT’s requirement of maintaining appropriate security. Some corporations keep all data points under lock and key. That causes frustrations at several levels, especially when users want to merge datasets to uncover new insights. Other companies have set up analytics in a way that completely neglects the need to supervise usage. Users can pull and analyze their data from any source. However, with several datasets created from differing sources floating around, it becomes challenging to figure out what the single version of the truth is.
Cultivating an environment that allows for data governance while encouraging self-service in a centralized manner can address many of the woes mentioned above. As you deploy and configure your self-service tools, make sure to establish the right auditing measures and necessary controls that provide users with data access, but also allows IT to gain the transparency they need to understand who uses what data. Taking some time to spell out permissioning and sharing capabilities can go a long way to helping you keep a handle on what represents your source of truth.
Over to You
Self-service analytics can deliver great value for many organizations, but if implemented without thought, it’s easy for value to get lost in the excitement. Recognizing and preventing some common self-service analytics mistakes will help business intelligence take root across your organization, empowering decision makers with the reports, visualizations, and datasets they need to make sound business decisions.
If you want to know more about self-service analytics and how to make them work for your organization, check out our blog on democratizing data.
