November's New Features: You Asked; We Updated
Tables and notes and reports — resized! This month at Heap we are highlighting some highly requested usability updates to dashboards, plus an easier way to invite more team members to Heap.
Heap’s dashboards organize relevant reports in the same space, so you can review your team’s key analytics in an organized way. With our latest product update, we’ve made dashboards better than ever so you can act on insights with agility and speed.
Watch this space for ongoing product updates and releases as we’ll be coming back each month to geek out with you over new stuff.
Latest Updates November 2020
What’s New?
Tell a Story With Customized Reports
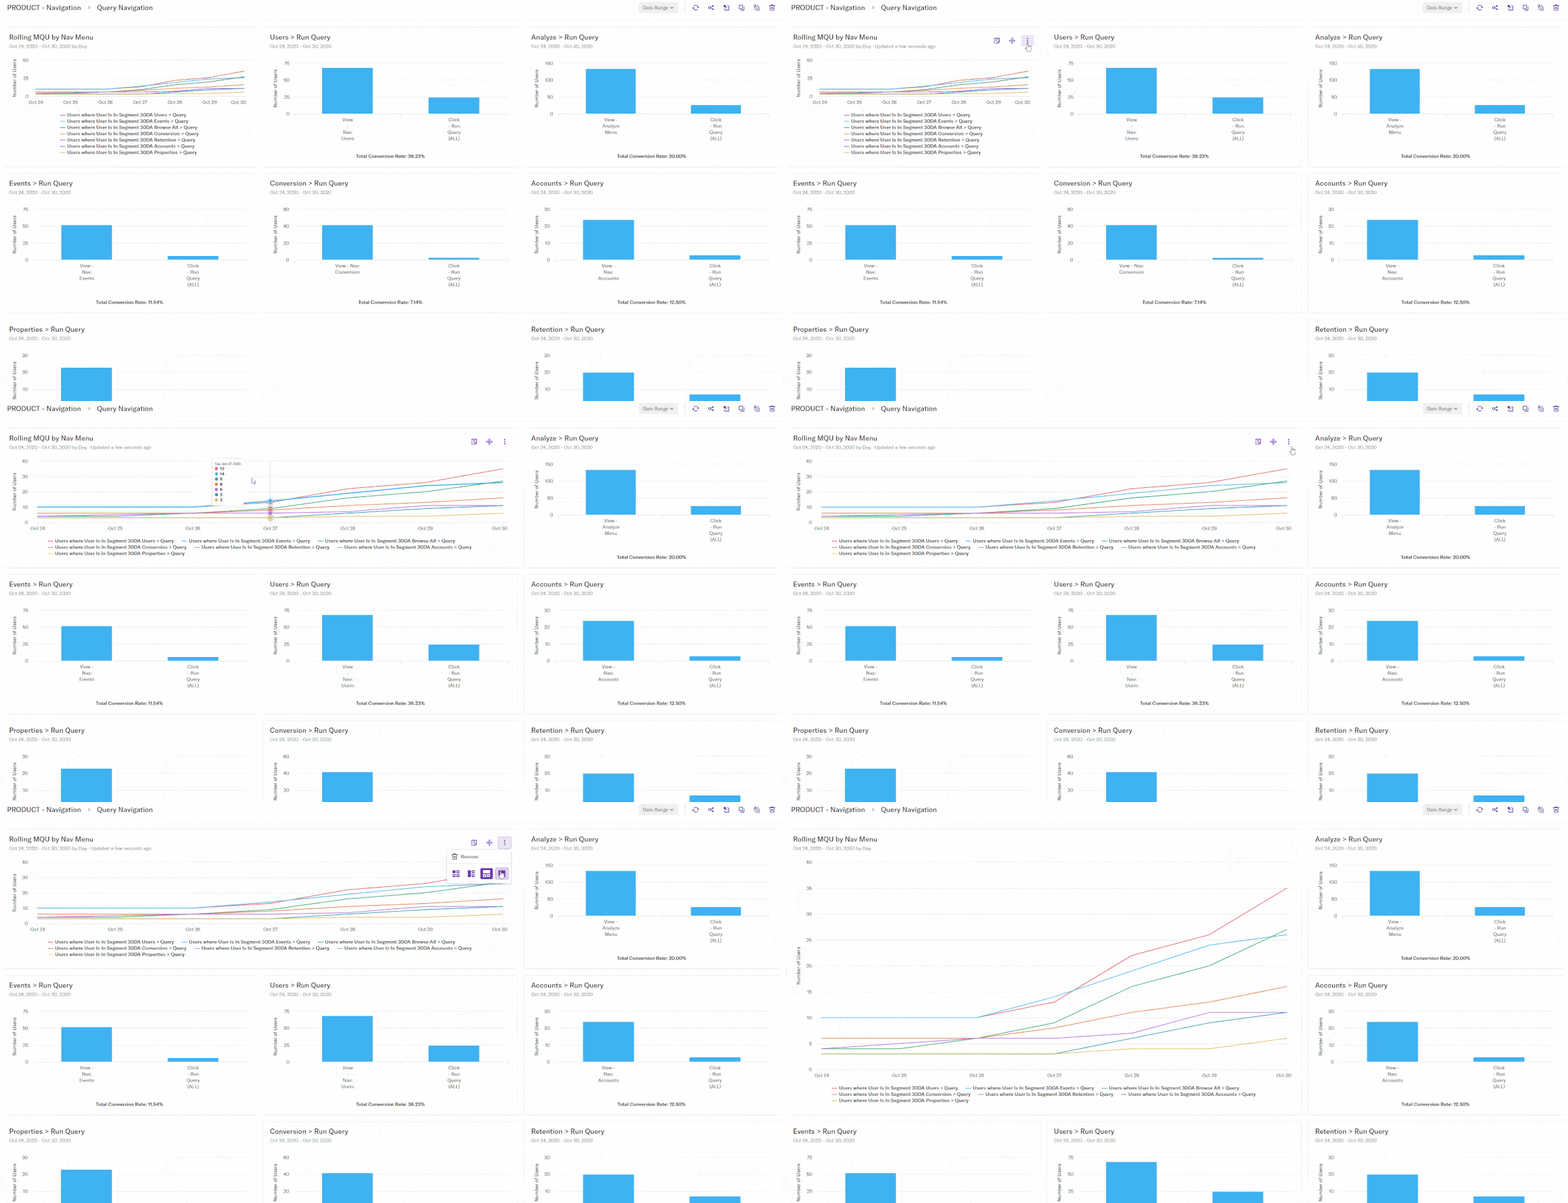
When it comes to displaying reports, we’ve realized that one size does not fit all. Dashboard reports can now be resized to accommodate those that need more room to convey information (like graphs with a “group by” or table reports).
Let your dashboards tell a story, and lead with the heavy-lifters. Not all metrics are created equal, so make the most important ones BIG.
Resize Report Gift

Resize reports in dashboards
Take Note(s) of Insights
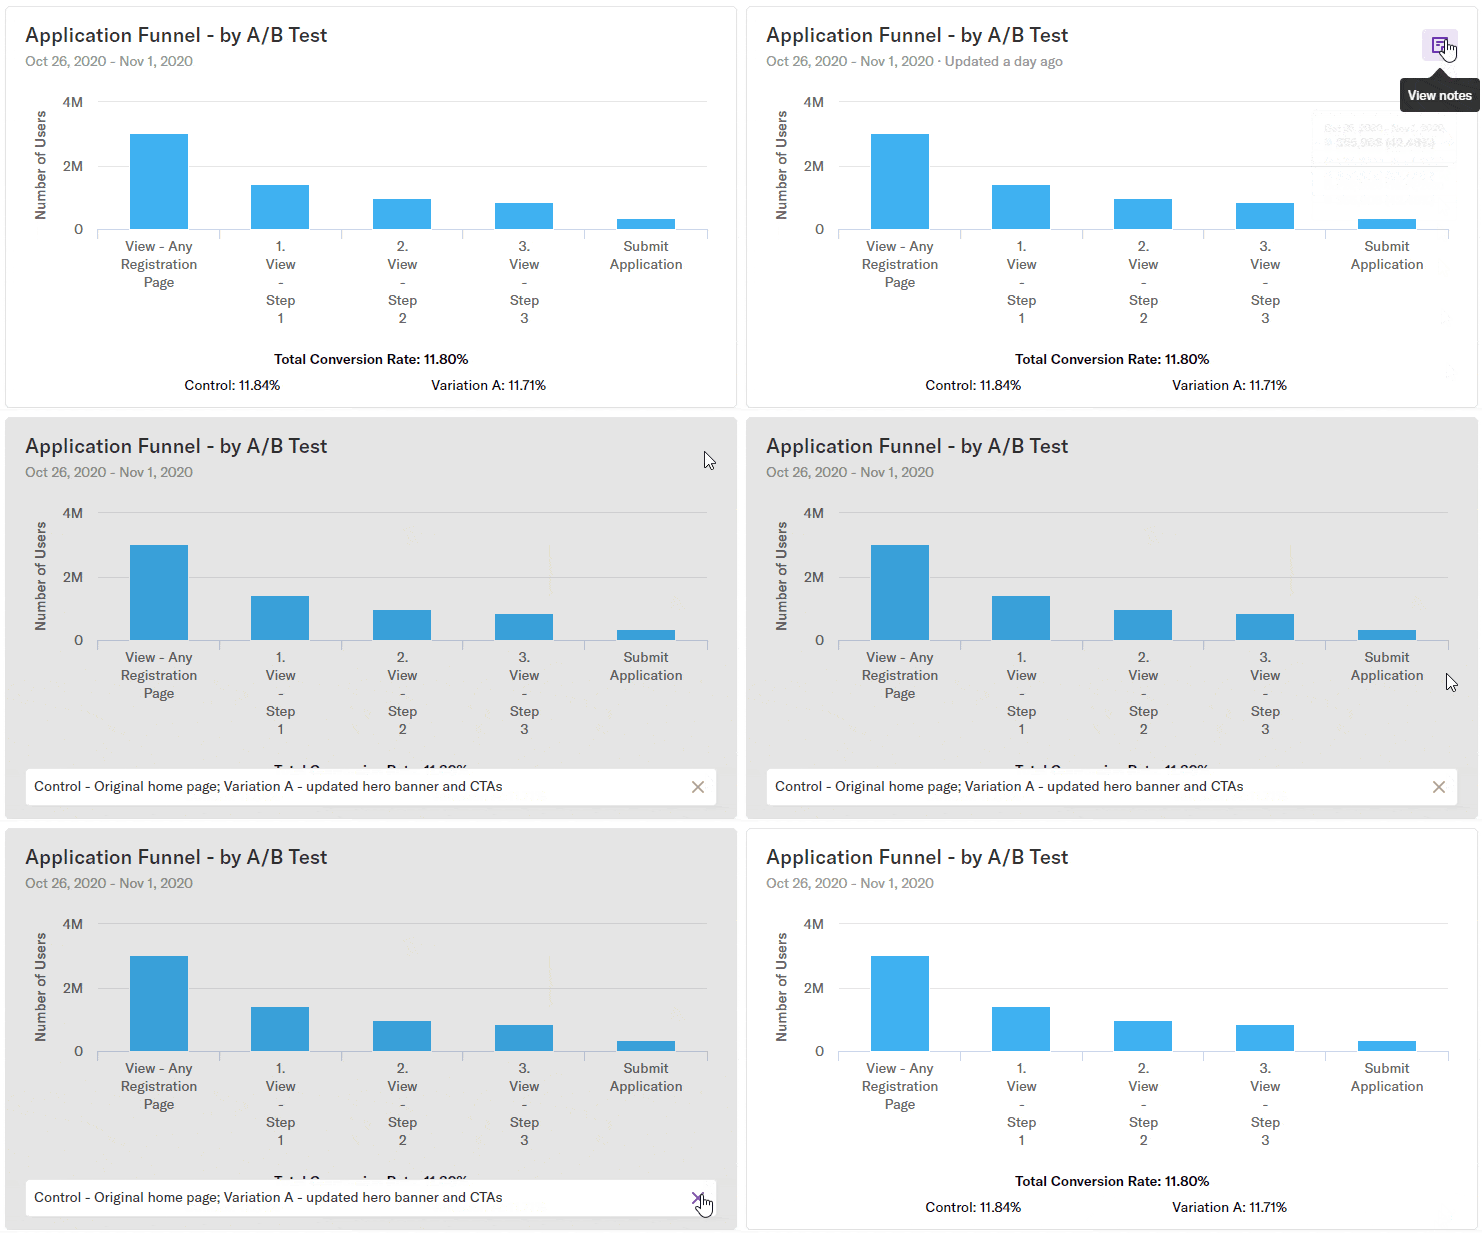
If you’re a fan of Post-It’s, you’ll want to take note of this new feature (sorry, we couldn’t resist). Notes that were created on reports now appear directly on those reports in dashboards.
Fewer clicks to insights? Nice.
You can use notes in dashboards to help other stakeholders in your organization understand key takeaways from reports. Or use them to add helpful context when looking at a shared report.
Funnel Notes Gif

View report notes directly in dashboards
Table Views in Dashboards
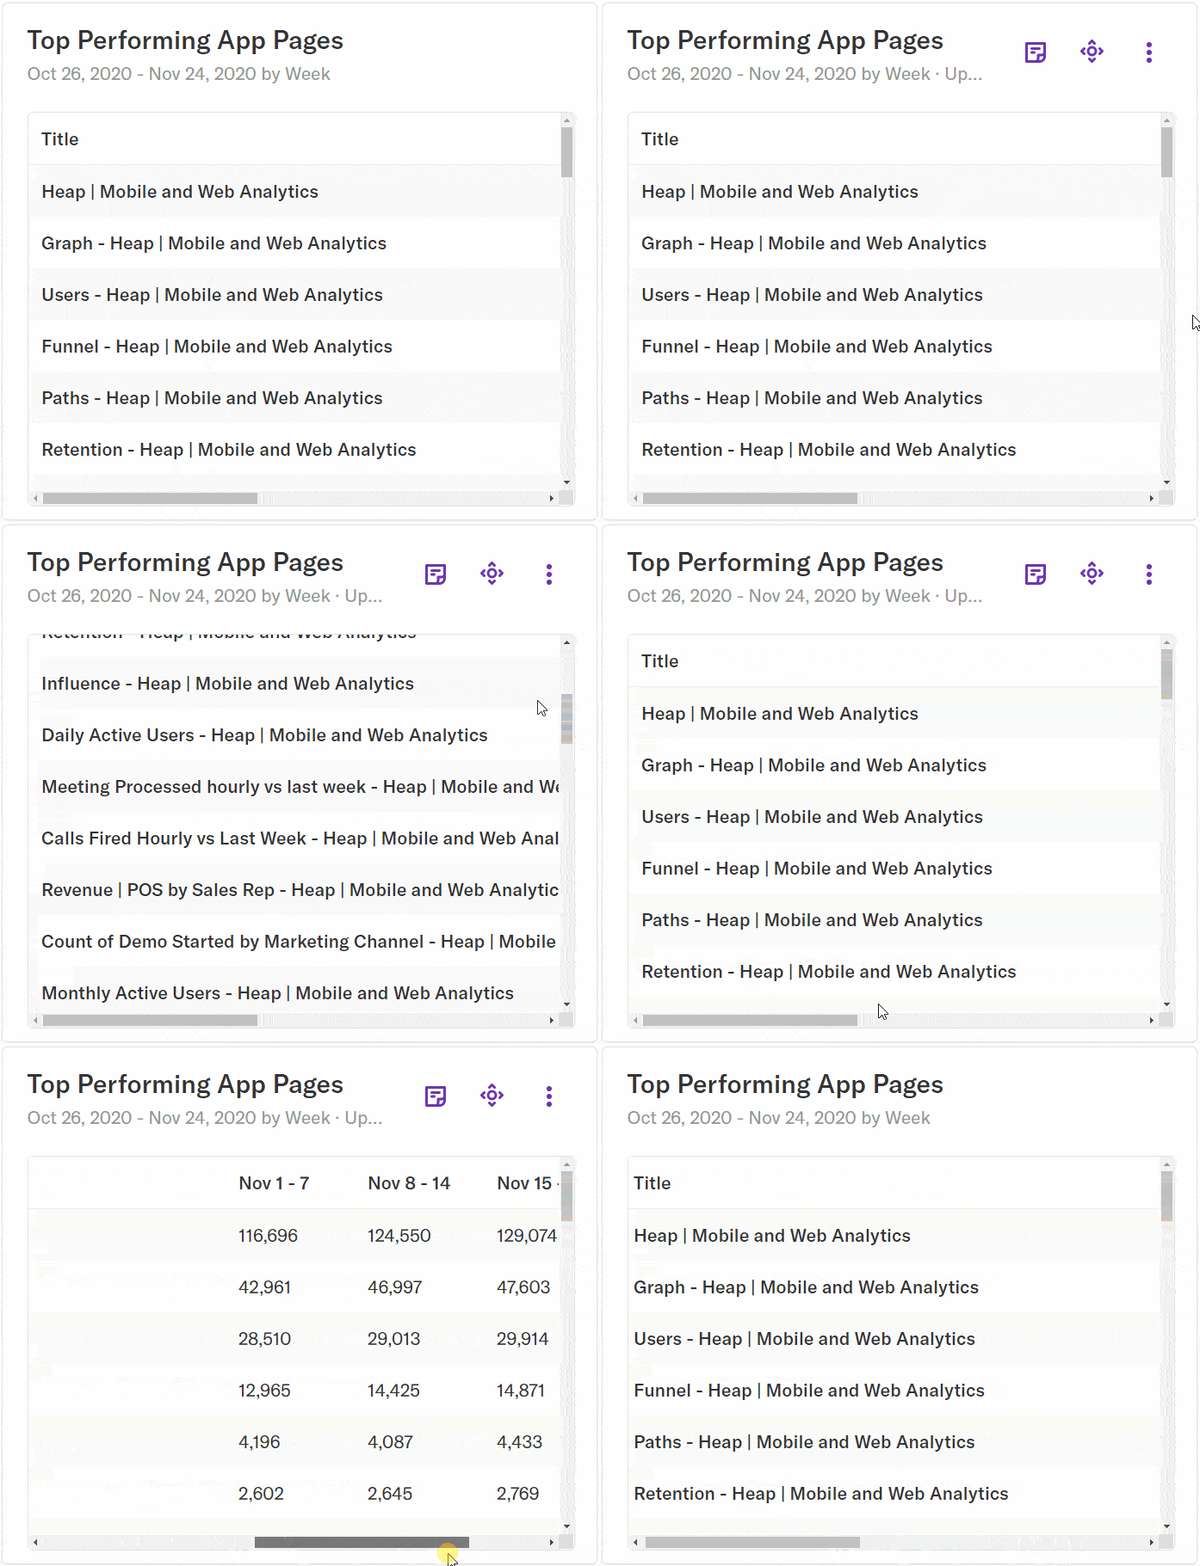
Your dashboards support line graphs, pie charts, bar graphs…and now tables! With table views in dashboards, you can pin a report (saved analysis results) as a table to get quick insights from listed data.
This is helpful for keeping close tabs on lists of unhealthy accounts or top performing features. If you’re a customer success manager listing out accounts by activity, you can easily identify the inactive accounts that you need to track down to re-engage.
Table Gif

View reports as tables in dashboards
For more tips on setting up your dashboard and taking advantage of our favorite report features, visit the Heap Help Center.
Bulk Up on Invitations
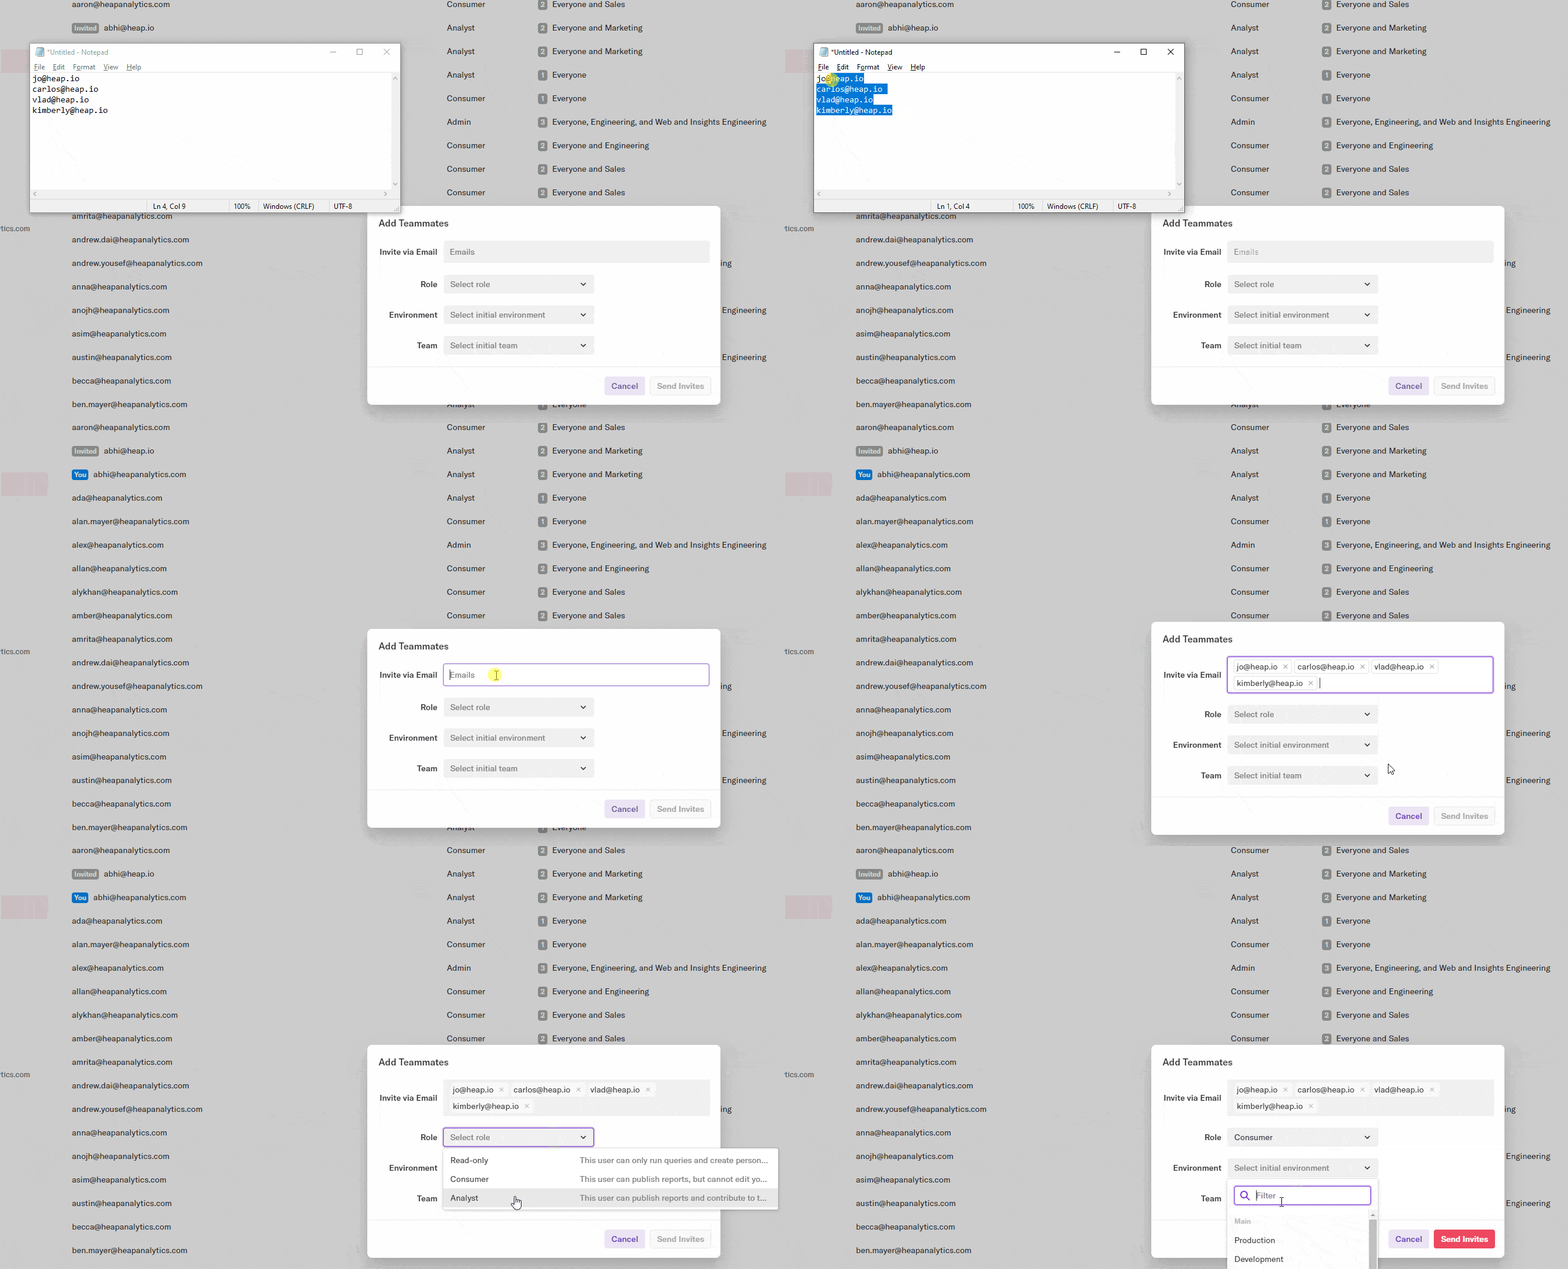
Now you can invite everyone to the analytics party! With bulk invitations, you can add multiple teammates to your company’s Heap account at the same time — the more the merrier.
But wait — we made it even easier. You can also copy a list of emails, paste them directly into the email input field, and voilà! Your teammates practically invite themselves.
Bulk Copy Paste Gif

Bulk invite your teammates to Heap
Save time and share insights faster. Add your whole team today!
Thanks to You
This product update was made possible by users like you! Many thanks to all of our users whose insightful feedback put these product features on the map. You’ve got great ideas — keep ‘em coming at feedback@heap.io.
And don’t forget to check back here next month for more new stuff!
Want to see more insights in action? Reach out to our team here to see what Heap’s analytics platform can do for you.

