Data-Driven
This calculator lets you test the impact of your product ideas. Here's how.
As a Product Manager, you’re bombarded with countless ideas and initiatives, each holding the promise of moving the needle. Indeed, part of your job as PM is deciding which ideas to invest in and which to postpone.
As good PMs, we’re all (hopefully) trained to ask two questions before making any potential investment:
1) How many users will be exposed to my change?
2) How much will that change impact my users' behavior?
Wouldn’t it be nice if you could answer these questions before taking a project on?
Now you can.
Enter the Impact Calculator— a simple tool for quickly understanding the potential impact of any project so you can compare the value of different initiatives you’re considering.
If you've ever grappled with questions like, "Should we focus on user activation or retention? Which change will make a bigger difference to the business?"—you're in the right place.
What levers to pull
There are many ways to move a metric, but the success of any initiative at improving a KPI ultimately depends on two key factors. We can chart them as “Scope vs. Magnitude.”
Larger audience Generally, an improvement that impacts 1,000 users will move the overall KPI more than a similar improvement that only impacts 100 users
Bigger swings
An improvement that impacts the user experience more meaningfully will make a larger impact.
It may sound obvious, but every PM has encountered a proposal for a change that minimally affects the user experience, but is presented as one that will make a big impact
(see: button colors)
The Impact Calculator evaluates your ideas for changes in a user flow and measures their effect on a higher-level KPI. It starts by analyzing your current baseline measurements for your flow, and then predicts how your proposed changes will impact those baseline measurements.
It does this by tracking how the scope and magnitude of the change will affect the baseline metrics.
Here’s what it looks like:

Using the calculator: an example
Let's look at an example and see how you might use the calculator to determine which intervention to make.
Let's say your website has a signup flow. The goal of this flow is to get self-service users into the product without assistance from sales.
Your signup flow has three stages:
Stage 1: Viewing the signup form
Stage 2: Filling out the form
Stage 3: Submitting the form
We want to see which changes to this flow will have a bigger potential impact on the number of signups. To the calculator we go!
Step 1 - Calculate your baseline metrics
The first thing you need to enter is the baseline metrics for the signup flow. These will be the higher-level KPIs you’re trying to change.
First, enter the number of visitors to the overall experience. You can choose any time period. Just make sure you stick with the same time period in the next steps.
You’ll then need to enter the conversion rate for the overall experience.
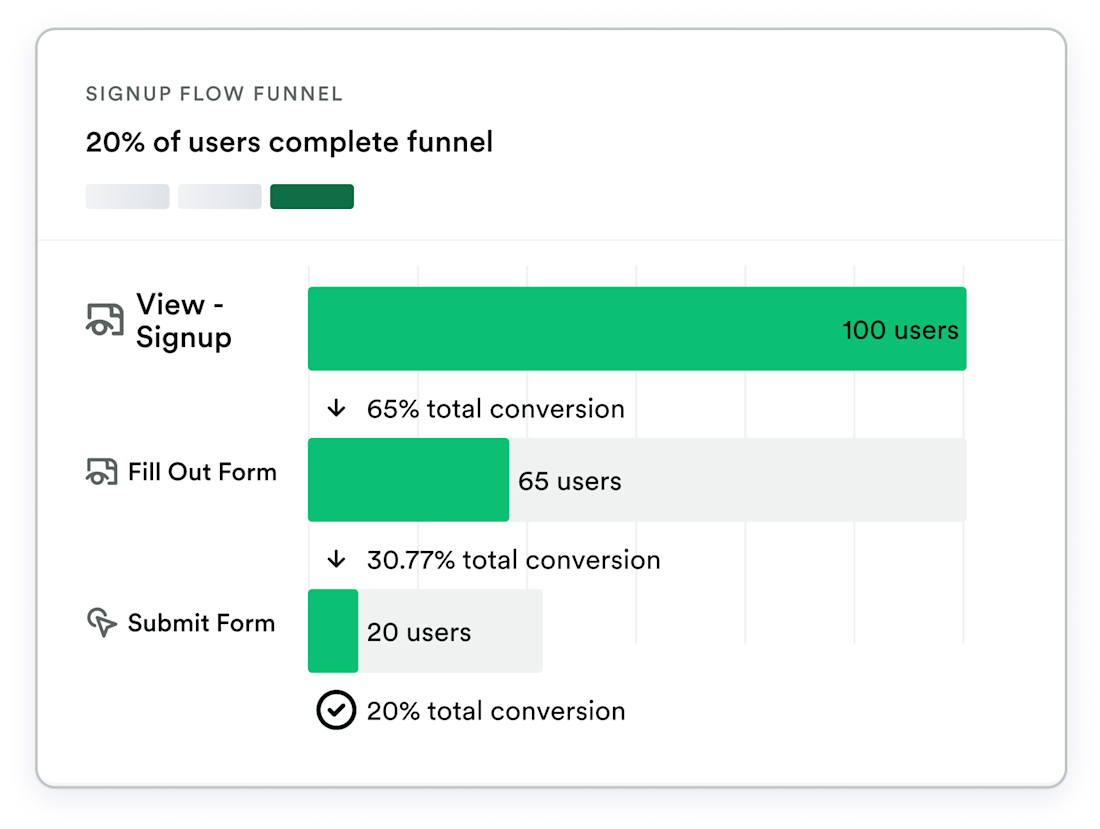
The easiest way to get these two metrics might be to build a funnel of your signup flow. Here’s what it might look like:

In this example, the signup flow gets 100 visitors with a 20% conversion rate for completing the flow. (i.e. 100 users enter the funnel, and 20 complete it.)
Enter those numbers into the calculator:

Again, these are the numbers we're trying to influence. Our goal is to figure out which intervention will make the biggest impact on these numbers.
Another way to say this is that when using the calculator to compare potential interventions, these numbers shouldn’t change - you'll enter them once and see how they're affected by the other numbers you input.
Step 2 - How many users will see the change you are making?
Here we’re making an estimate of Scope.
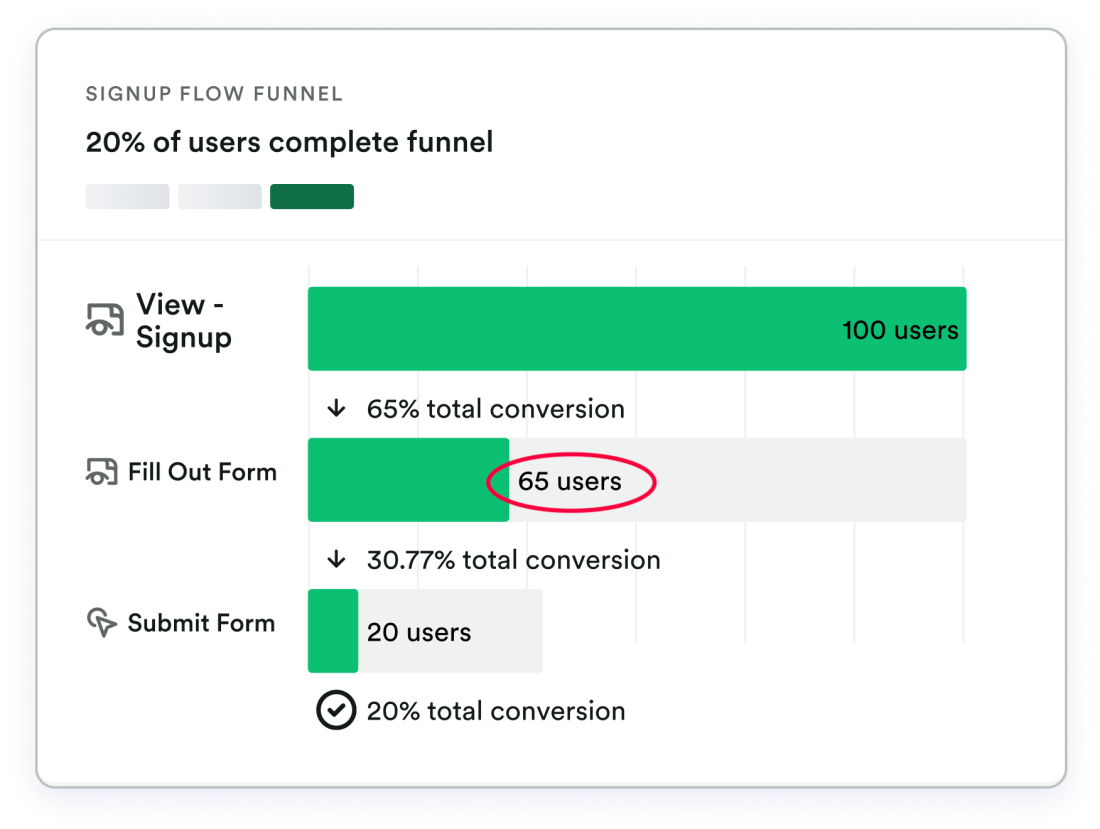
In our signup flow example, let’s say we are considering modifying our sign-up form—the second stage of the flow. We need to find the number of users that reach that second stage. So we go back to our funnel and see how many users convert from stage 1 to stage 2.

We can see that 65 visitors reached the 2nd stage of the flow.
Enter 65 into the calculator like this:

This step is meant to answer the question of “How many users will be exposed to my change?”
If you are making a change that all users will see, such as doing something to modify the first stage of the signup flow, this number will be the same as the baseline number you entered in step 1.
Step 3 - What is the current conversion rate for users that will see the change?
Another baseline metric: for users who will see the change, what is their current conversion rate?
In our example, this would be the conversion rate between stage 2 (where we are making the change) and stage 3. This is the localized conversion rate we’ll be trying to change.

Going back to our funnel, 30.77% of users who reach stage 2 manage to convert to stage 3, submitting the form. You'll need to round that number to the nearest whole number and enter that into the calculator like this:

Remember, this is the conversion rate of users in the second stage, which is higher than the overall conversion rate.
Step 4 - An educated guess
Up until this point, we’ve been working with the numbers you already have. For the last step of the Impact Calculator, you’ll need to make an educated guess. What do you think the conversion rate will be for the part of the experience you are changing, after you make your change?
In other words, what will the conversion rate be for users who see the change?
Put even differently, if we’re making a change on stage 2 of our signup flow, we’ll be estimating what the new conversion rate will be for stage 2.
You can base this assumption on prior experiments and your product knowledge. When in doubt, it’s best to be conservative with your estimate. You can also try different values to see how sensitive your outcome is to the assumptions you are making.
In our example, the current conversion rate for stage 2 is 31%. (Which you entered in the box above.) Our hypothesis is that the change we make to our form will raise that conversion rate to 45%. That means that after you make your change, you think that 45% of users who reach stage 2 will complete the signup form. Enter that 45% here:

Step 5 - Results
Now that you’ve inputted everything the calculator needs, go ahead and hit calculate
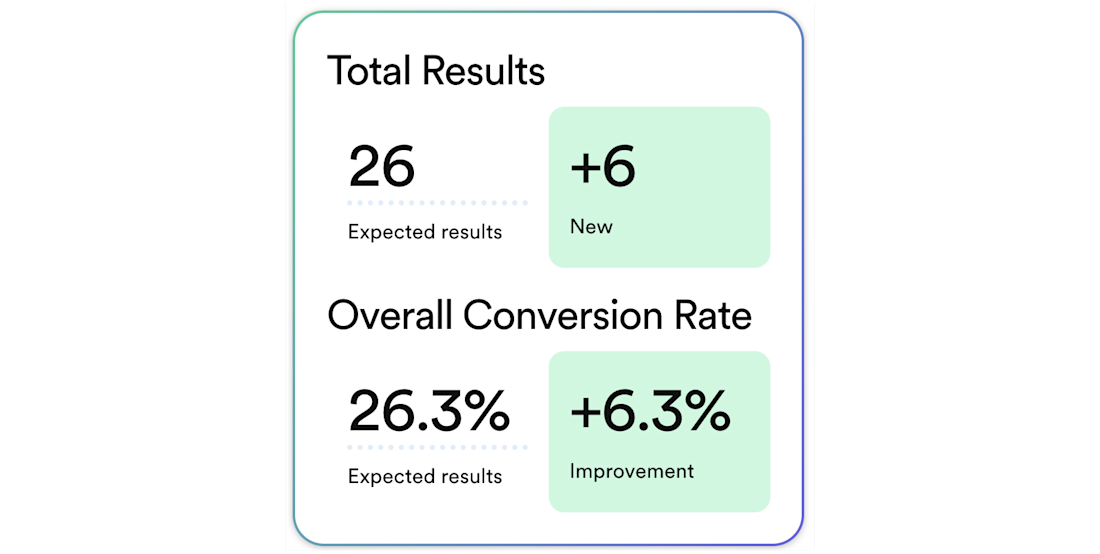
The calculator will tell you the number of conversions you can expect after making the change and the expected new overall conversion rate.

Here’s how to read this:
In our example, if we optimize Stage 2 of our signup flow and raise the conversion rate to 45% (our hypothesis), we should gain 6 new conversions. Note that this number is rounded to a whole number.
If our initial conversion rate was 20%, our intervention should raise that rate to 26.3%.
Step 6 - Compare to a different potential intervention
Now that you know how much positive impact your idea will have, it’s time to implement it, right? Wrong!
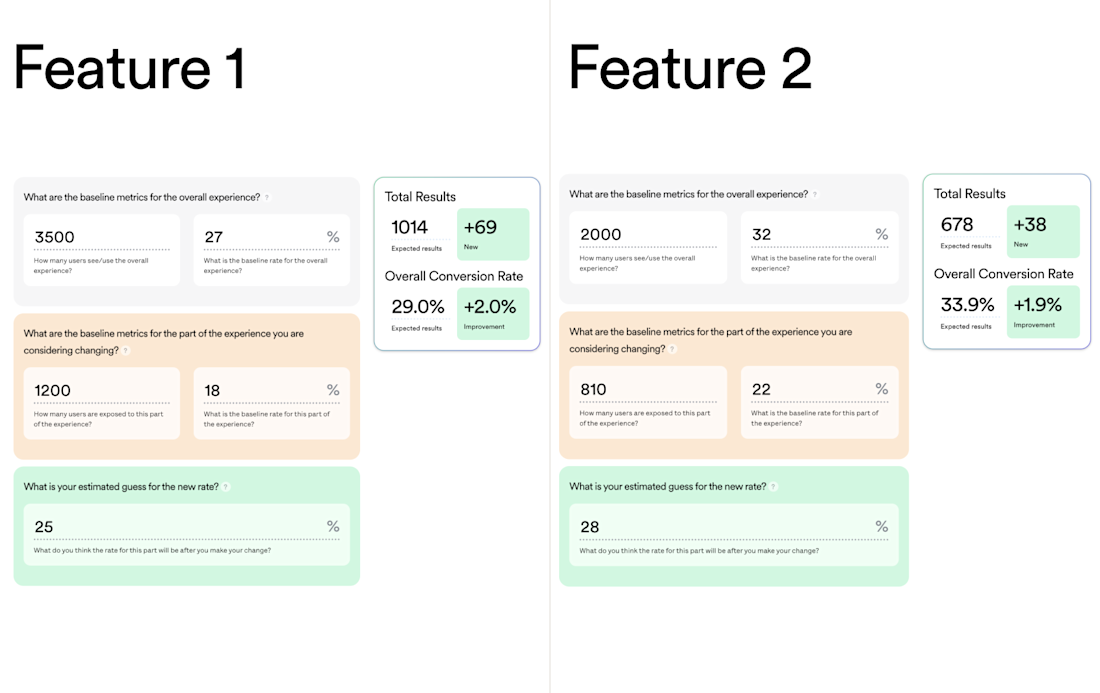
As a good PM, you know there are an infinite amount of changes you can make. So don’t just settle on your first idea. Come up with a different idea, make new estimates, and see which one performs best.
Use the Impact Calculator to measure the difference in performance between your ideas so you can make the best investment!
Ready to try the calculator for yourself?
Best Practices for Sizing Impact
Opportunity size multiple projects you are considering and compare
Part of the value of this opportunity sizing framework is it is fast and highly repeatable. When making decisions about your roadmap, you’ll benefit from opportunity sizing frameworks by evaluating multiple projects and picking the ones with the highest potential impact.

Find reasonable upper and lower bounds
Try different assumptions about the expected increase in conversion rate to see how different assumptions affect the overall goal. When in doubt, be conservative. If a lower-range estimate still shows a strong lift or lift stronger than the estimates you’ve done for other projects, the prioritization decision becomes much more straightforward. These kinds of exercises are usually not about forecasting as accurately as possible. That’s not the goal! Rather, they’re about making the right prioritization decisions and figuring out if your roadmap is setting your team up to hit their goals.
Record your opportunity sizing exercise
After rolling out the feature, you can return to the assumptions you made in your opportunity sizing analysis to see where you over and under-estimated. Revisiting your assumptions is an important practice for building your product sense and improving the accuracy of your assumptions in the future.
Conclusion
Always keep the scope and magnitude levers top of mind. The calculator discussed in this post is just one way of approaching opportunity sizing that works well for rate (percentage) KPIs common among product teams. However, the same way of thinking works for all types of KPIs. Quantifying your total impacted population and estimating in a data-driven way how much of an impact you can make is an easy way to become more data-driven, build a roadmap that sets your team up for success, and meaningfully move the needle on your KPIs.
Getting started is easy
Start today and elevate your analytics from reactive reporting to proactive insights. What are you waiting for?

